Do You Need a Tetanus Booster After an Insect Bite or Sting?
Learn when an insect bite or sting may trigger a tetanus-booster question, how CDC wound categories work, and when to contact a clinician.
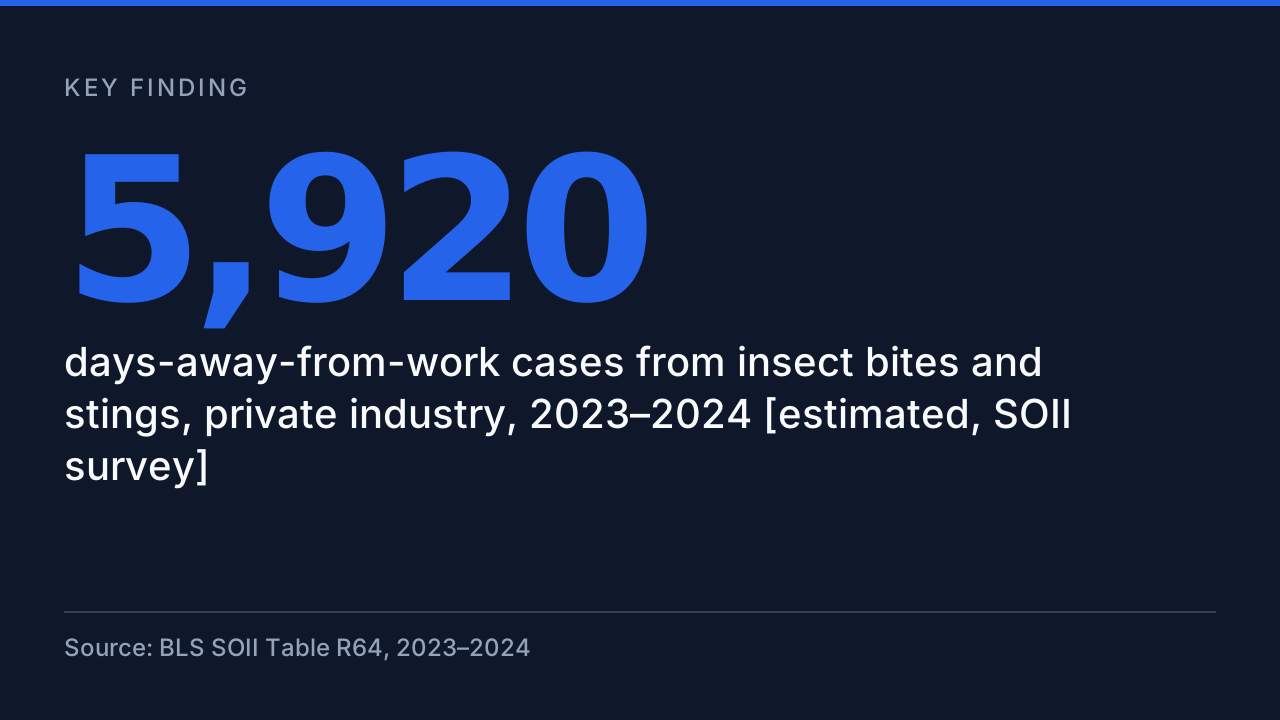
How many workers are killed or lose workdays to insect bites and stings? The joined BLS record: 83 deaths in 2003–2010, 5,920 lost-time cases in 2023–2024 — and the coding break that stops the two eras forming one trend.
Source: BLS SOII Table R64, 2023–2024 (2024)
Ask how dangerous insect stings are at work and every answer traces back to a single document: the Bureau of Labor Statistics analysis published in 2014, whose data ends in 2010. The record did not stop there — the packaging did. BLS has since published the continuation inside its general tables, most recently the 2023–2024 Survey of Occupational Injuries and Illnesses (SOII) case tables and the 2024 Census of Fatal Occupational Injuries (CFOI). This page joins the two eras in one place: 5,920 in the newest survey period (BLS SOII Table R64, 2023–2024, 2024), and 10 in the newest census year (BLS CFOI Table A-9, 2024, 2024).
If you work outdoors, the safety point comes before the statistics. Anaphylactic shock is the mechanism that kills in these cases — it featured in 39 in the old census (BLS Beyond the Numbers (2014), 2010). Know the warning signs of anaphylaxis — trouble breathing, throat tightness, dizziness, swelling of the lips or tongue — and treat them as an emergency: epinephrine first, then 911. Workers with a known sting allergy should tell their employer and crew, and carry their prescribed auto-injector; our guide to when a second EpiPen dose is needed covers what happens after the first.
One warning about how to read everything below. These numbers come from two different instruments: CFOI is a census — a complete count of fatal work injuries — while SOII is a survey of employer logs that produces estimates for nonfatal cases. Every figure on this page carries its system and its period, and the two eras are never added together or drawn as one trend line, because the classification underneath them was rebuilt in between. For the practical side, see our outdoor worker bite and sting prevention guide; this page is the numbers.
The Census of Fatal Occupational Injuries counted 83 involving insects, arachnids and mites across 2003–2010 (BLS Beyond the Numbers (2014), 2010) — an average of 10 a year, peaking at 15. Bees were responsible for 52, more than wasps, spiders and ants combined, and farming, construction and landscaping occupations together accounted for two thirds of the deaths.
| METRIC | VALUE | SOURCE |
|---|---|---|
| Fatal injuries involving insects, total, 2003–2010 [CFOI census] | 83 | BLS Beyond the Numbers (2014) |
| Fatal injuries involving bees | 52 | BLS Beyond the Numbers (2014) |
| Fatal injuries involving wasps (incl. yellow jackets) | 11 | BLS Beyond the Numbers (2014) |
| Fatal injuries involving spiders | 7 | BLS Beyond the Numbers (2014) |
| Fatal injuries involving ants | 4 | BLS Beyond the Numbers (2014) |
| Fatal injuries involving other or unknown insects | 9 | BLS Beyond the Numbers (2014) |
| Event coded as injections, stings or venomous bites | 70 | BLS Beyond the Numbers (2014) |
| Deaths directly caused by an insect | 72 | BLS Beyond the Numbers (2014) |
| Deaths indirectly caused (falls, crashes while evading) | 11 | BLS Beyond the Numbers (2014) |
| Case narratives noting anaphylactic shock | 39 | BLS Beyond the Numbers (2014) |
| Farming occupations | 20 | BLS Beyond the Numbers (2014) |
| Construction occupations | 19 | BLS Beyond the Numbers (2014) |
| Landscaping occupations | 17 | BLS Beyond the Numbers (2014) |
| Texas, state of incident | 21 | BLS Beyond the Numbers (2014) |
The deaths were heavily seasonal and heavily clustered in a few kinds of outdoor work. Almost 94% of them occurred between the start of April and the end of October (BLS Beyond the Numbers (2014), 2010), with September the deadliest single month at 17. In 33 of the direct cases the worker was attacked by multiple insects at once, and 27 of those swarm attacks involved bees — typically a disturbed nest or hive, the exact scenario described in our account of bee and wasp attacks on farmworkers. Men accounted for 82 of the deaths, and 21 of the dead were self-employed — a detail that matters later in this article, because the modern survey that counts nonfatal cases never sees self-employed workers at all.
By industry rather than occupation, agriculture, forestry, fishing and hunting recorded 22 deaths and construction 21, with landscaping services alone at 12. Texas recorded 21 deaths — a quarter of the national total, against roughly a ninth of all fatal workplace injuries — and Florida was second with 8. What the table cannot show is mechanism at the level of the individual case beyond the anaphylaxis count: BLS coded 70 of the deaths to the sting or venomous bite itself, while the indirect deaths — including five workers who fell from a tractor while trying to escape insects — are a reminder that the hazard is not only venom. Workers facing a swarm mid-task need the response drilled in advance; our multiple wasp sting first aid page covers it.
On the nonfatal side, the SOII survey estimated between 4,930 to 6,870 days-away-from-work cases involving insects in each year from 2008 to 2010 (BLS Beyond the Numbers (2014), 2010). More than 65% of the cases in every one of those years were stings or venomous bites rather than nonvenomous bites, and the counts covered private industry and government together.
| METRIC | VALUE | SOURCE |
|---|---|---|
| Days-away-from-work cases involving insects, 2008 [SOII] | 6,540 | BLS Beyond the Numbers (2014) |
| Days-away-from-work cases involving insects, 2009 [SOII] | 6,870 | BLS Beyond the Numbers (2014) |
| Days-away-from-work cases involving insects, 2010 [SOII] | 4,930 | BLS Beyond the Numbers (2014) |
| Event: injections, stings or venomous bites, 2008 [SOII] | 4,750 | BLS Beyond the Numbers (2014) |
| Event: nonvenomous bites, 2008 [SOII] | 1,690 | BLS Beyond the Numbers (2014) |
| Building and grounds cleaning and maintenance occupations, 2008 [SOII] | 1,530 | BLS Beyond the Numbers (2014) |
| Private-industry cases, 2010 [SOII] | 3,650 | BLS Beyond the Numbers (2014) |
Three features of the old nonfatal series are worth holding on to, because each one disappears from the modern tables. First, the counts are all-ownership: in 2010, 3,650 of the cases were in private industry, but local government — public administration crews, road and parks workers — contributed a substantial block of its own. The modern case tables in the next sections are private industry only. Second, the old survey published the split by event: stings and venomous bites were 4,750 of the 2008 cases, nonvenomous bites 1,690, so a reader could see that the burden was mostly venom, not bites. Third, the series was annual. A safety manager in 2011 could watch the number move year to year; after this period, that annual visibility is exactly what goes away.
The occupation pattern also differed from the fatal table in an instructive way. Transportation and material moving and construction and extraction occupations ran consistently high alongside building and grounds work — truck drivers, delivery drivers and labourers who encounter nests in loading areas, meter boxes and stored materials. California, Florida, New York and Texas each recorded the largest state counts in all three years, though in those large states insect cases were still under one percent of all lost-time cases. The broader point stands in our bee sting hub: most occupational stings are routine injuries that cost a day or two of work — the fatal tail is what the census counts, and it is driven by allergy, not by the sting alone.
The old survey series did not end in 2010 — it continued annually inside BLS’s general tables, unheralded. In 2018, private industry recorded 10,060 days-away-from-work cases coded as bites and stings (BLS SOII Table R31, 2018, 2018), within 13,550 animal and insect related incidents in total. Of the bites and stings, 2,600 were stings and venomous bites and 1,090 were nonvenomous insect bites.
| METRIC | VALUE | SOURCE |
|---|---|---|
| Animal and insect related incidents, total, 2018 [SOII, old coding] | 13,550 | BLS SOII Table R31, 2018 |
| Bites and stings (event 131), 2018 [SOII, old coding] | 10,060 | BLS SOII Table R31, 2018 |
| Stings and venomous bites (event 1311), 2018 [SOII, old coding] | 2,600 | BLS SOII Table R31, 2018 |
| Nonvenomous insect bites (event 1312), 2018 [SOII, old coding] | 1,090 | BLS SOII Table R31, 2018 |
| Other animal bites, nonvenomous (event 1313), 2018 [SOII, old coding] | 5,710 | BLS SOII Table R31, 2018 |
This snapshot matters for one reason: it is the last reading taken with the old ruler. In the OIICS version then in force, bites and stings sat inside a category headed ‘violence and other injuries by persons or animals’ — which is why anyone searching older BLS tables for a contact injury finds nothing, and why the numbers in this section cannot simply be placed next to the 2023–2024 figures that follow. The composition is also a standing warning against loose headlines: the insect-specific lines (stings and venomous bites plus nonvenomous insect bites) together were well under half of the bites-and-stings total, because animal bites bulk so large in employer logs.
After 2018 the annual case-and-demographic series stops being annual. BLS moved this detail to a two-year cycle, and when it re-emerged for 2023–2024 it did so under a rebuilt classification and a broader case definition. The honest way to present the record is therefore as three snapshots taken with three related but different instruments — which is how the rest of this page treats it.
In the newest SOII release, private-industry employers reported 5,920 days-away-from-work cases from insect bites and stings across 2023–2024 (BLS SOII Table R64, 2023–2024, 2024), or 7,740 cases counting job transfer or restriction as well. Insects are the smaller part of their own headline category: the full bitten-or-stung total was 21,180, and most of it — 14,970 — was nonvenomous animal bites rather than insects.
| METRIC | VALUE | SOURCE |
|---|---|---|
| Contact with animals (event 62), days-away cases, 2023–2024 [SOII] | 27,150 | BLS SOII Table R64, 2023–2024 |
| Bitten or stung by animal (event 621), days-away cases, 2023–2024 [SOII] | 21,180 | BLS SOII Table R64, 2023–2024 |
| Insect bites and stings (event 6211), days-away cases, 2023–2024 [SOII] | 5,920 | BLS SOII Table R64, 2023–2024 |
| Insect bites and stings (event 6211), DART cases, 2023–2024 [SOII] | 7,740 | BLS SOII Table R64, 2023–2024 |
| Insect bites and stings (event 6211), transfer/restriction-only cases, 2023–2024 [SOII] | 1,810 | BLS SOII Table R64, 2023–2024 |
| Nonvenomous animal bites, except bugs (event 6213), days-away cases, 2023–2024 [SOII] | 14,970 | BLS SOII Table R64, 2023–2024 |
| Venomous animal bites, except bugs (event 6212), days-away cases, 2023–2024 [SOII] | 170 | BLS SOII Table R64, 2023–2024 |
| Struck by animal (event 622), days-away cases, 2023–2024 [SOII] | 5,080 | BLS SOII Table R64, 2023–2024 |
By sector, the modern burden sits where the service economy’s outdoor-adjacent workforce sits. Professional and business services recorded the most insect days-away cases at 1,330 — that super-sector is where landscaping services is classified, so the grounds crews of the fatal table are in there, filed under a business-services label. Trade, transportation and utilities followed at 1,040, then education and health services at 760 and other services at 750. Goods-producing industries together recorded 940, split between construction at 440 and manufacturing at 260 — the figure one trade blog seized on to call the hazard negligible for process industries, which is true for factories and misleading as a general conclusion. Food-service and hospitality sites, where yellowjackets around bins and outdoor seating are a standing hazard — see our page on yellowjackets and dumpsters for restaurant workers — sit inside the leisure and hospitality line at 270.
The number that looks wrong is natural resources and mining: 250. In the fatal census, farming was the deadliest line of work; in the modern survey it barely registers. That is not a change in the fields — it is the survey’s scope. SOII excludes farms with fewer than 11 employees (BLS SOII Table R64, 2023–2024, 2024) and does not cover the self-employed at all, and in the old census 21 of the dead were self-employed. The modern survey structurally under-sees exactly the workforce the old census found dying. Any employer-side reading of this table should start there, and with the unglamorous controls in our outdoor bite prevention checklist: nest awareness in stored materials and meter boxes, protective clothing, and a crew that knows who is allergic before the sting, not after.
The fatal census gives the modern era its first two readings under the new classification. In 2024, contact with animals killed 41 workers (BLS CFOI Table A-9, 2024, 2024): 13 were bitten or stung, of whom 10 were insect cases, while 27 were struck by an animal. In 2023 the bitten-or-stung count was higher, at 22, with 18 insect deaths. Both years sit inside a total of 5,070 fatal work injuries in 2024.
| METRIC | VALUE | SOURCE |
|---|---|---|
| Contact with animals (event 62), fatal injuries, 2024 [CFOI] | 41 | BLS CFOI Table A-9, 2024 |
| Bitten or stung by animal (event 621), fatal injuries, 2024 [CFOI] | 13 | BLS CFOI Table A-9, 2024 |
| Insect bites and stings (event 6211), fatal injuries, 2024 [CFOI] | 10 | BLS CFOI Table A-9, 2024 |
| Struck by animal (event 622), fatal injuries, 2024 [CFOI] | 27 | BLS CFOI Table A-9, 2024 |
| Bitten or stung by animal (event 621), fatal injuries, 2023 [CFOI] | 22 | BLS CFOI Table A-9, 2023 |
| Insect bites and stings (event 6211), fatal injuries, 2023 [CFOI] | 18 | BLS CFOI Table A-9, 2023 |
| Contact with animals (event 62), fatal injuries, 2023 [CFOI] | 40 | BLS CFOI Table A-9, 2023 |
| All fatal work injuries, United States, 2024 [CFOI] | 5,070 | BLS CFOI Table A-9, 2024 |
Two cautions belong with these small numbers. First, counts this size swing: the drop from 22 bitten-or-stung deaths in 2023 to 13 in 2024 is nine cases, and a single swarm incident can move a year. Second, the new census publishes less anatomy than the old one: there is no species split for the modern fatal cases, no anaphylaxis count, no occupation table for this event in the headline release — the texture that made the 2003–2010 analysis so quotable has not been republished. Most animal-contact deaths in 2024 were not stings at all: 27 workers were struck by animals, including workers stepped on, kicked or trampled, which is a cattle-and-horses problem that shares a category with bees only on paper.
For scale, NIOSH has long cited 90 to 100 deaths a year in the United States from allergic reactions to insect stings across all settings (BLS Beyond the Numbers (2014), 2014) — a general-population figure, quoted inside the BLS analysis, that shows how small the workplace slice is and how concentrated it is in outdoor jobs. The practical conclusions have not changed since the old record: a worker with a known allergy is carrying a life-threatening risk into exactly the environments where stings are routine, so the allergy belongs in the site briefing, the epinephrine belongs within reach, and the crew should know the difference between a large local reaction and anaphylaxis and what to do after using an EpiPen. The data’s job is to show the risk is real, current, and still unglamorous — a handful of deaths and several thousand lost workdays a year, hiding in tables almost nobody reads.


Every figure here is drawn from the U.S. Bureau of Labor Statistics: the 2014 Beyond the Numbers analysis of CFOI and SOII data (Pegula & Kato), SOII Table R31 for 2018, SOII Table R64 for 2023–2024, and CFOI Table A-9 for 2023 and 2024, cross-checked against the CFOI 2024 chart package. CFOI figures are measured counts from a census; SOII figures are estimates from a sample survey of employer logs, and the two systems are never added together. Three breaks in the record are stated rather than smoothed over: OIICS version 3 moved bites and stings from the violence family (event 13x) to contact incidents (event 62x) for 2023 data forward; the SOII case-and-demographic series went biennial and DART-based with the 2023–2024 release; and SOII excludes farms with fewer than 11 employees and the self-employed, whom CFOI counts. Research limits, named per the method: reader demand for this topic was unmeasured in the discovery run (Stage 1 ran degraded, by hand, with no counted forum threads); the backlink format filter (Stage 3) did not run, so no claim is made about which formats earn links in this niche; the recency sweep (Stage 6a) ran degraded — the sweep script’s Reddit leg was blocked and its other legs need a key — and was completed by hand through web search, which found no newer US dataset; the existence gate (Stage 4) was run manually against a fresh 690-URL sitemap corpus of stinghelp.com and returned CLEAR; BLS blocks scripted fetches from this host, so every BLS source was read in a browser during this run and Table R64 was parsed from BLS’s own spreadsheet file; all visuals are drawn locally from the fact sheet. This page will be updated on the CFOI 2025 release and the SOII 2025–2026 biennial release.
In the newest census year, 10 workers died from insect bites or stings at work (CFOI 2024, event 6211), out of 13 deaths from being bitten or stung by any animal. The last time BLS averaged the toll, for 2003–2010, it was 10 deaths a year — the same nominal pace, counted under a rebuilt classification, so the two figures describe continuity, not a measured trend. (BLS CFOI Table A-9, 2024, 2024)
Across 2023–2024, private-industry employers reported 5,920 cases where an insect bite or sting cost a worker at least one day away from work, and 7,740 cases counting job-transfer-or-restriction outcomes as well (SOII Table R64). The survey excludes small farms and the self-employed, so the true count is higher. (BLS SOII Table R64, 2023–2024, 2024)
In the 2003–2010 census, farming occupations recorded 20 of the 83 deaths, construction 19 and landscaping 17 — together two thirds of all fatal cases. The modern survey cannot reproduce that table: it excludes farms with fewer than 11 employees and the self-employed, who were 21 of the 83 deaths in the old census. (BLS Beyond the Numbers (2014), 2010)
Bees, by a wide margin. Bees were involved in 52 of the 83 fatal occupational injuries in 2003–2010, against 11 for wasps (including 3 yellow-jacket incidents), 7 for spiders and 4 for ants. The modern census no longer publishes a species split for fatal cases. (BLS Beyond the Numbers (2014), 2010)
The ruler changed twice. From 2023, BLS codes bites and stings under OIICS version 3 as contact events (62x); before that they sat in a violence category (13x). And the SOII case series itself went biennial and DART-based with the 2023–2024 release. The old and new figures are each accurate inside their own system — they are not points on one line. (BLS SOII Table R64, 2023–2024, 2023)
Yes — and they are the bigger half of the category. In 2023–2024 the survey recorded 14,970 days-away cases of non-venomous animal bites other than 'bugs' (the line that carries most dog bites), against 5,920 insect bite and sting cases. Any headline that calls the whole 21,180 'bitten or stung' total an insect figure is misreading the table. (BLS SOII Table R64, 2023–2024, 2024)
Treat it as a known workplace risk, not a private detail: tell your employer and crew, and carry your prescribed epinephrine. In 39 of the 83 fatal case narratives from 2003–2010 the worker suffered anaphylactic shock — and 5 workers used or tried to use an epinephrine autoinjector or antivenom and still died, which is why a sting with breathing difficulty, throat tightness or dizziness is a 911 call, not a wait-and-see. (BLS Beyond the Numbers (2014), 2010)
Last updated:
This article is for informational purposes only and isn’t medical advice. If you’re worried about a bite or sting, talk to a healthcare professional.
Dr. Jones oversees StingHelp’s clinical verification process. Every guide is systematically evaluated against active Centers for Disease Control and Prevention (CDC), Environmental Protection Agency (EPA), and American Academy of Allergy, Asthma & Immunology (AAAAI) medical consensus standards to ensure symptom distinctions and care recommendations are clinically sound.
Explore physician-reviewed first-aid procedures, identification clues, and symptom comparisons for other common outdoor bites and stings.
Learn when an insect bite or sting may trigger a tetanus-booster question, how CDC wound categories work, and when to contact a clinician.
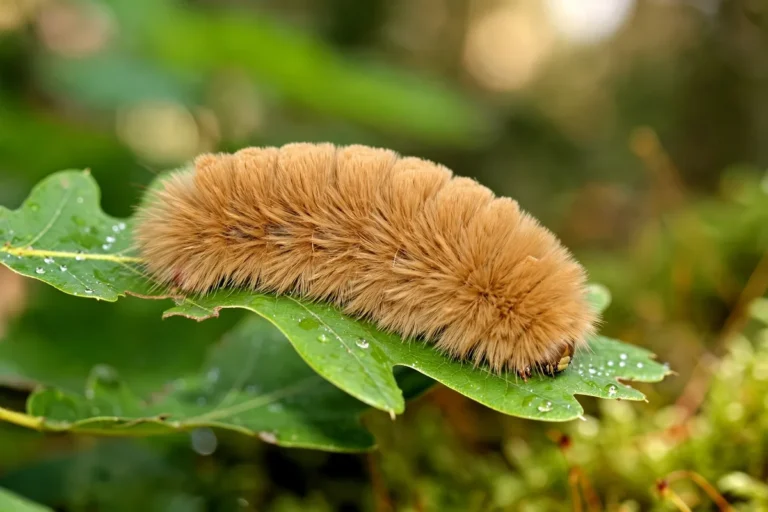
Learn puss caterpillar sting treatment, how to remove venomous hairs, relieve pain and swelling, avoid common mistakes, and recognize emergency warning signs.
Learn black widow bite treatment, first-aid steps, muscle-cramp and pain warning signs, Poison Control guidance, and when emergency care is needed.