Scorpion Stings per Year and Antivenom Cost per Vial: Arizona and US Data, by Counting System (2026)
Poison centers logged 185,402 US scorpion reports in 2005–2015, yet a 2025 study estimates 178,625 stings in one Arizona county in five years. Every count and every antivenom price — $100 to $39,652 a vial — with its system, year and label.
Scorpion Stings per Year and Antivenom Cost per Vial: Arizona and US Data, by Counting System (2026)
By StingHelp Editorial Team9 min read
178,625
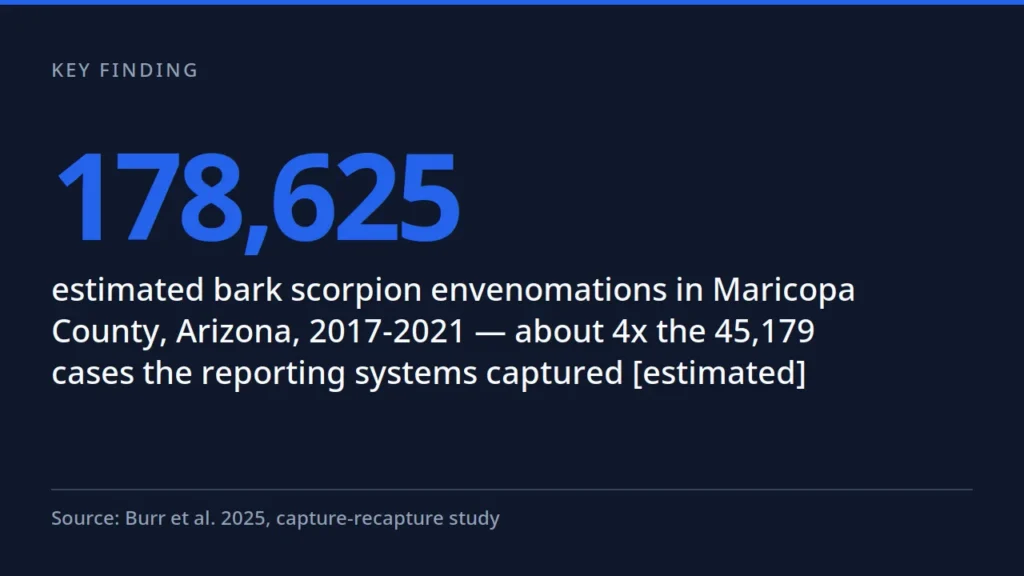
An estimated 178,625 bark scorpion envenomations actually occurred in Maricopa County, Arizona alone during 2017–2021 — about four times the 45,179 cases the county's hospital and poison-center systems captured between them (capture-recapture estimate, Burr et al. 2025). [ESTIMATED]
→ 45,179 Scorpion envenomations reported across Maricopa County's two systems (hospital discharge data + poison center) during 2017–2021 — the reported base the 178,625 estimate is built from. [REPORTED] (Burr et al. 2025, Vector-Borne and Zoonotic Diseases (PubMed), 2021)
→ $7,900–$39,652 What Arizona patients were billed per vial of scorpion antivenom in a 2015 American Journal of Medicine analysis — hospital charges, not the hospital's cost and not what insurers finally paid. The sister product retailed in Mexico at $100 a vial. [BILLED CHARGES, US, 2015] (Boyer 2015, The American Journal of Medicine, 2015)
→ 3 vials The FDA-labelled starting dose of Anascorp, the only FDA-approved scorpion antivenom in the US. Further vials are given one at a time, 30–60 minutes apart, only if the hospital team judges them needed. [FDA LABEL, revised 2022] (Anascorp FDA label, DailyMed, 2022)
→ 66.7% Children under 10 accounted for 184 of the 276 major-effect (life-threatening) scorpion cases reported to US poison centers in 2005–2015 — the severe end of scorpion stings is mostly a children's problem. [REPORTED] (Kang & Brooks 2017, Journal of Medical Toxicology (NPDS 2005–2015), 2015)
Ask how many scorpion stings happen in Arizona each year and you will collect at least four different answers — an average of 11,500 poison-center reports a year (Kang & Brooks 2017 (NPDS), 2015), a state health department figure of more than 10,000 recorded stings, and, for a single Arizona county, an estimated 178,625 actual envenomations across five years (Burr et al. 2025, Vector-Borne and Zoonotic Diseases (PubMed), 2021). Ask what the antivenom costs and the answers scatter wider still: $100 a vial in Mexico (Boyer 2015, The American Journal of Medicine, 2015), or bills of $7,900–$39,652 a vial in Arizona (Boyer 2015, The American Journal of Medicine, 2015). None of these numbers is lying. Each one comes from a different counting system, a different year and a different layer of the price chain — and almost every page quoting them drops those labels. This page keeps them on. For what to do in the minutes after a sting, start with our bark scorpion sting first aid guide; this article is the data behind it.
One safety point before any table. Most reported stings are handled without a hospital visit — 90.1% of US cases were managed on-site (Kang & Brooks 2017 (NPDS), 2015) — but scorpion venom hits small children hardest, and a stung child should be assessed by medical professionals immediately, not watched at home. Trouble breathing, uncontrolled jerking or muscle twitching, drooling, and roving or abnormal eye movements are emergency signs: call 911 at once. US Poison Control answers around the clock at 1-800-222-1222. Whether antivenom is given is a decision for the hospital team treating the patient — the cost data below explains the bills; it is never a reason to delay or refuse emergency care. Our emergency signs page lists the symptoms that mean drop everything and call.
1 How Many Scorpion Stings Get Reported in the US Each Year?
US poison centers received 185,402 scorpion exposure reports between 2005 and 2015, an average of 16,855 a year (Kang & Brooks 2017 (NPDS), 2015). Arizona alone contributed 126,502 of them — 68.2% of the national total (Kang & Brooks 2017, Journal of Medical Toxicology (NPDS 2005–2015), 2015) — which makes the familiar ‘about eleven thousand Arizona stings a year’ line a poison-center report average, not a count of stings.
METRIC
VALUE
SOURCE
US exposures reported to poison centers, total [reported]
The widely repeated ‘about 11,000 scorpion stings a year in Arizona’ figure traces to this poison-center average. It counts reports — and, as the next section shows, most stings are never reported.
Kang & Brooks 2017 (NPDS), 2015
Reported scorpion exposures by state, total across the study window
Arizona reports, total 2005–2015 [reported]
126,502
Texas reports, total 2005–2015 (1,743/year average) [reporte
19,168
Nevada reports, total 2005–2015 (707/year average) [reported
7,775
Arizona is not the largest slice of this problem; it is most of it. The bark scorpion is the only US scorpion whose sting regularly produces body-wide effects, and its range covers Arizona plus small parts of neighbouring states — which is why the Arizona bark scorpion and its striped lookalike are worth telling apart, and why Texas, where the common species is the striped bark scorpion, logs thousands of reports but almost no major effects. Stings peak in the warm months and the evening hours, and the pattern holds for visitors too — desert camping country is bark scorpion country, as our scorpion sting guide for desert camping covers.
Read the label on every figure in this table: [reported]. Poison centers log calls, and calls are voluntary. Someone who recognises a bark scorpion sting, treats the pain at home and never phones in does not exist in this dataset — which is why 90.1% of cases being managed on-site still understates how many stings never enter any system. The near-total share happening at home (97.8%) is also why so much prevention is domestic: beds pulled from walls, cots isolated, and shoes shaken out — the habits in our scorpion-in-shoes prevention guide exist precisely because bedrooms, not trails, are where America gets stung.
2 How Many Stings Actually Happen? One County, Counted Two Ways, Then Estimated
In Maricopa County — Arizona’s most populous county — hospitals and the regional poison center together captured 45,179 bark scorpion envenomations across 2017–2021 (Burr et al. 2025 (PubMed), 2021). A capture-recapture study published in 2025 then estimated the number that actually occurred: 178,625(Burr et al. 2025, Vector-Borne and Zoonotic Diseases (PubMed), 2021), roughly ≈4× the captured count.
METRIC
VALUE
SOURCE
Envenomations captured by both systems combined [reported]
For every scorpion case Maricopa County’s two systems recorded, the study estimates about three more happened that neither system ever saw.
Burr et al. 2025 (PubMed), 2021
Capture-recapture works like this: take two incomplete lists of the same events — here, hospital discharge records and poison-center consultations — count how many cases appear on both, and the overlap tells you how large the unseen remainder must be. Burr and colleagues found the poison center had been consulted on roughly sixty percent more cases than hospitals recorded (30,331 against 17,884), and even both systems together were seeing only about a quarter of the estimated total. The method has assumptions — it cannot count a sting whose victim appears on neither list and never seeks any care — so read 178,625 as the best modelled estimate, not a hidden exact count. It is labelled [estimated] everywhere on this page for that reason.
Set the Arizona figures side by side and the ‘contradictions’ in the press dissolve. The state health department’s more than 10,000 recorded stings (Arizona Department of Health Services (director's blog), 2011) is a two-center recorded total from the Anascorp-approval era. The 11,500 a year from the first section is a national database’s Arizona average over a different decade. The more than 5,000 calls in the table above (Banner Health press release, 1 Apr 2025, 2024) is one center, covering Maricopa County only, in a single recent year. And the capture-recapture estimate says the actual number of envenomations in that same county ran to roughly thirty-five thousand a year. Different systems, different years, different catchments — every figure is honest about what it measures, as long as nobody strips the label off.
3 The Severe End: Hospital Stays, ICU Admissions and Children Under 10
The severe tail is small but real. Among reported cases, Arizona recorded 858 hospitalizations across the study window (Kang & Brooks 2017 (NPDS), 2015), and children under ten accounted for 184 of the 276 major, life-threatening cases nationwide (Kang & Brooks 2017 (NPDS), 2015). The antivenom and ICU numbers in this table are what the price data in the next section is ultimately paying for.
METRIC
VALUE
SOURCE
Arizona hospitalizations among reported cases, total [reported]
Children under 10: a fraction of all stings, but two-thirds of the life-threatening cases — and the age group that receives antivenom most often.
Kang & Brooks 2017 (NPDS), 2015
The concentration in small children is the single most important pattern in the national data. Children under ten were stung less often than adults in raw counts, yet they hold 66.7% of the major-effect cases (Kang & Brooks 2017, Journal of Medical Toxicology (NPDS 2005–2015), 2015) and were admitted at several times the all-ages rate — small bodies receive a larger venom dose per kilogram, and the neurotoxic syndrome (uncontrolled movements, roving eyes, excess secretions, breathing difficulty) develops fastest in them. This is why the guidance for a stung toddler is not ‘watch and wait’: our scorpion sting first aid for toddlers page walks through the first minutes, and size is no protection myth either — baby scorpions cannot meter their venom the way folklore claims, but that is not what makes children the risk group; body weight is.
Two further patterns deserve note. First, Arizona’s state health department separately puts intensive-treatment cases at about 200 children a year (Arizona Department of Health Services (director's blog), 2011) — higher than the poison-center admission average in the table, from a different system over different years; both are printed here, unmerged, because they measure different streams. Second, Arizona ICU admissions fell from 111 → 16 across the study window while the frequency of major effects stayed flat. Kang and Brooks note the decline began as the trial of the modern F(ab’)2 antivenom started in Arizona — an association the study reports, not proof of cause, and one reason the economics of that antivenom, next, matter beyond the pharmacy.
4 What Does One Vial of Antivenom Cost? Four Prices, Not One
Of everything stacked into a US vial’s price, the physical product — research, animal care, manufacturing and bottling — is about fourteen dollars. The rest is the system around it.
Boyer 2015, The American Journal of Medicine, 2015
The antivenom price chain per vial, in US dollars
Retail price of the sister antivenom product in Mexico, per
$100
US wholesale price of Anascorp, per vial [US, 2011]
$3,500
Price Arizona hospitals paid the distributor, per vial [US,
$3,780
Largest true cost to payers per vial — legal, regulatory and
$4,100
A hospital charge is a list price from the hospital’s chargemaster, set by each hospital and then heavily discounted for insurers who have contracts — Boyer’s central point is that the astonishing figures in news stories are mostly this discounted-away layer, not money anyone collected. Underneath it, his model found the largest genuine cost to payers was not the drug’s manufacture but the legal, regulatory and hospital machinery of selling it in the US ($4,100). The same vial’s physical production — research, horse care, manufacturing, bottling — came to $14. When a headline quotes one number as ‘the cost of scorpion antivenom’ without naming its layer and year, it is quoting a layer, not a fact.
The one US attempt to price a whole case rather than a vial is the 2013 decision model in the table: a mean of $10,708 with antivenom against $3,178 without, built from Arizona Medicaid cost data (Armstrong et al. 2013, Toxicon (PubMed), 2013). The model also found antivenom treatment more effective — and its authors still concluded it was not cost-effective at the US marketed price, suggesting formularies reserve it for the most severe envenomations. That is a health-economics judgement about a price, not a bedside rule: which patients receive antivenom is decided by the treating team on clinical grounds, and no figure on this page should be read as advice to seek or refuse it.
5 How Many Vials Does a Patient Get? The Dose That Multiplies the Bill
Anascorp’s FDA label sets the starting dose at 3 vials(Anascorp FDA label, DailyMed, 2022), with any further vials given 1 vial at a time only if signs persist (Anascorp FDA label, DailyMed, 2022). In the Arizona hospital survey, patients received three to five(KFF Health News, 28 Nov 2011, 2011) — so the per-vial charge, whatever layer of it a family ends up facing, is multiplied several times in almost every treated case.
FDA-labelled initial dose of Anascorp [label revised Aug 2022]
Anascorp FDA label, DailyMed, 2022
Multiply the layers and the notorious bills stop being mysterious. A starting course of 3 vials at the top surveyed Arizona charge ($12,000) is how a pharmacy line passes fifty thousand dollars before the ER, the ICU bed or the observation stay is counted — KFF’s 2011 reporting made exactly that calculation with the prices of its day. None of that arithmetic decides an individual bill: charges are discounted, insurers negotiate, hospitals write down, and two patients given the same drug in the same week can owe wildly different amounts. What families can control is earlier in the chain — recognising a severe sting fast and getting to care, which is a first-aid question, not a finance one.
The same vial-count logic applies beyond people: dogs are stung in the same homes and yards, and veterinary antivenom decisions carry their own version of this price chain — see our scorpion sting in dogs guidance for the animal side. Back on the human side, if swelling or symptoms are spreading rather than settling, treat it as a medical problem first and a data point never: our guide to sting swelling that becomes an emergency marks the line. The numbers on this page exist so that, afterwards, the bill can be read for what it is — a charge layer, from a stated year, on top of a drug whose manufacture costs about $14.
Key statistics at a glance | Source: see numbered sources below
Explore every figure in this article
Metric
Value
Year
Source
US scorpion exposures reported to poison centers, total 2005–2015 [reported]
This page was built by the DataGap Method in a fully degraded run, and the degraded stages are part of the record. Demand for this topic was not measured: the first stage ran manually through host web search because the Reddit route is blocked from this host and no ScrapeCreators key was available, so the cluster carries a counted thread demand of zero. The supply-side format check — which formats earn citations on this topic — did not run. The recency sweep was also a manual web-search fallback after the sweep script hit the same Reddit block. The existence gate ran manually over a 689-URL sitemap corpus after the vendor sitemap script crashed on this host; it returned NEAR for this topic (a section hit on the site’s bark scorpion first-aid page), and this article was cleared only as the burden-and-pricing data asset, with first aid deliberately left to that page. Images are locally drawn SVG charts, not AI renders. Every figure carries the system that produced it and a [reported], [measured] or [estimated] label, because the three are not interchangeable: poison-center figures count voluntary reports and understate incidence, hospital discharge data count visits only, and the one true-incidence figure here is a capture-recapture estimate for a single county. Verification note: the scripted checker could not fetch PubMed, Banner Health or the American Journal of Medicine page (host blocks and a JavaScript shell), so every fact drawn from those sources was instead confirmed by opening and reading the page directly; that is stated in the fact sheet. The scorpion row of the NPDS 2024 annual report could not be extracted reliably from its PDF in this run, so the national backbone is the peer-reviewed analysis of the 2005–2015 NPDS data. Prices are dated wherever quoted because no official current US price list is public.
Sources consulted: 24
Sources cited: 8
Data freshness: current year: 0, last year: 3, older: 5
Data range: 2011-01-01 to 2026-11-13
Research date: 2026-11-13
Update schedule: Annual, when the next NPDS annual report's scorpion table can be extracted and if a current official Anascorp price is published
Limitations: No US system counts every scorpion sting: poison-center figures are voluntary reports and understate incidence; hospital discharge data miss home-managed cases; the only true-incidence figure is a capture-recapture estimate for one Arizona county (Maricopa, 2017–2021) and is labelled ESTIMATED wherever used. The scorpion row of the NPDS 2024 annual report could not be extracted reliably from its PDF in this run, so the national backbone is the peer-reviewed NPDS analysis of 2005–2015. US antivenom prices are dated wherever quoted (2011 wholesale, 2013 modelled, 2015 charges) because no official current US price list is public; a widely repeated '$5,534 per vial' cash-price figure traced only to a secondary quote was excluded as unverifiable. Mexican and US prices are different markets and are never blended.
Frequently Asked Questions
How many scorpion stings happen in Arizona each year?
It depends which system you ask — and every answer is a different measurement. Poison centers logged an average of 11,500 Arizona reports a year in 2005–2015 (Kang & Brooks 2017). The state health department recorded 'more than 10,000' in a single year around 2011. But a 2025 capture-recapture study estimated about 35,700 envenomations a year actually occurred in Maricopa County alone — roughly four times what its reporting systems captured. There is no single true count; there are counts of reports, and one estimate of the real total. (Kang & Brooks 2017 (NPDS); Burr et al. 2025, 2021)
How many scorpion stings happen in the US each year?
US poison centers received 185,402 scorpion exposure reports from 2005 to 2015, an average of 16,855 a year (Kang & Brooks 2017, NPDS data). That is a count of reported cases, not national incidence: 90.1% of reported cases were managed at home, and the 2025 Maricopa County capture-recapture study suggests most stings are never reported to any system at all. (Kang & Brooks 2017, Journal of Medical Toxicology (NPDS), 2015)
What does one vial of scorpion antivenom (Anascorp) cost?
There are four different prices, and quoting one without its layer misleads. The sister product retailed in Mexico at $100 a vial (Boyer 2015). The US wholesale price at launch was $3,500 a vial, and Arizona hospitals paid a distributor about $3,780 (KFF Health News, 2011). What lands on a patient's bill is a hospital charge: $7,900–$39,652 per vial in the 2015 American Journal of Medicine analysis. Charges are not costs, and insurers rarely pay them in full. (Boyer 2015, AJM; KFF Health News 2011, 2015)
How many vials of antivenom does a scorpion sting patient get?
The FDA label for Anascorp sets the starting dose at 3 vials, with further vials given one at a time at 30–60 minute intervals only if the treating team judges them needed (DailyMed label, revised 2022). In the 2011 Arizona hospital survey, patients received three to five doses. Whether antivenom is given at all — and how many vials — is a decision for the hospital team treating the patient, based on how severe the envenomation is. (Anascorp FDA label, DailyMed; KFF Health News 2011, 2022)
How much does scorpion sting treatment cost in total?
The only US per-case figures come from a 2013 decision model built on Arizona Medicaid data: a mean cost of $10,708 for a case treated with antivenom versus $3,178 without it (Armstrong et al., Toxicon). Those are modelled payer costs from 2013, not today's bills — individual hospital charges vary enormously, and the per-vial charge range alone ($7,900–$39,652 in 2015) shows why two patients can receive wildly different bills for the same drug. (Armstrong et al. 2013, Toxicon (PubMed), 2013)
How many children end up in hospital from scorpion stings?
Children carry the severe end. In the 2005–2015 poison-center data, Arizona averaged about 78 hospitalizations a year among reported cases, and children under 10 had the highest hospitalization rate of any age group (2.1%, with 1.6% admitted to ICU) and 66.7% of all major-effect cases (Kang & Brooks 2017). The Arizona health department separately put intensive-treatment cases at about 200 children a year. Any child stung by a scorpion — especially a small child — should be assessed by medical professionals immediately. (Kang & Brooks 2017 (NPDS); Arizona Dept. of Health Services, 2015)
Are most scorpion stings dangerous?
Most reported stings are not life-threatening: 90.1% of US poison-center cases in 2005–2015 were managed on-site without a hospital visit, pain was the commonest effect (88.7%), and major effects were recorded in 276 of 185,402 reports (Kang & Brooks 2017). The exception is small children, who account for two-thirds of major cases. A stung child, or anyone with trouble breathing, uncontrolled jerking, drooling or abnormal eye movements, needs emergency care immediately — call 911 or Poison Control (1-800-222-1222 in the US). (Kang & Brooks 2017, Journal of Medical Toxicology (NPDS), 2015)
SJ
Dr. Sarah Jones, MD
MD — Medical Reviewer · Board-Certified Emergency Medicine Physician
Dr. Jones oversees StingHelp’s clinical verification process. Every guide is systematically evaluated against active Centers for Disease Control and Prevention (CDC), Environmental Protection Agency (EPA), and American Academy of Allergy, Asthma & Immunology (AAAAI) medical consensus standards to ensure symptom distinctions and care recommendations are clinically sound.
How this guide was prepared: Researched and structured by the StingHelp Editorial Team; verified against peer-reviewed dermatology literature; clinically reviewed November 2026.
RELATED CLINICAL GUIDES
More StingHelp guides
Explore physician-reviewed first-aid procedures, identification clues, and symptom comparisons for other common outdoor bites and stings.
No official count of US jellyfish stings exists. This audit lines up what poison centers, one ED, a state series and beach patrols actually recorded — and traces the unsourced '150 million' figure to its origin.
Every October, the same scene plays out in houses across the country: black-and-reddish bugs appear on sunny windows, gather on siding, and slip through…
STAY INFORMED
Keep practical guidance close.
Seasonal bite forecasts, updated first-aid protocols, and evidence-based outdoor prevention tips delivered to your inbox.
Your information is handled under our Privacy Policy. For urgent symptoms, seek medical help rather than waiting for an email response.