Jellyfish Stings in the United States: What Was Actually Counted (2026)
No official count of US jellyfish stings exists. This audit lines up what poison centers, one ED, a state series and beach patrols actually recorded — and traces the unsourced '150 million' figure to its origin.
Jellyfish Stings in the United States: What Was Actually Counted (2026)
By StingHelp Editorial Team10 min read
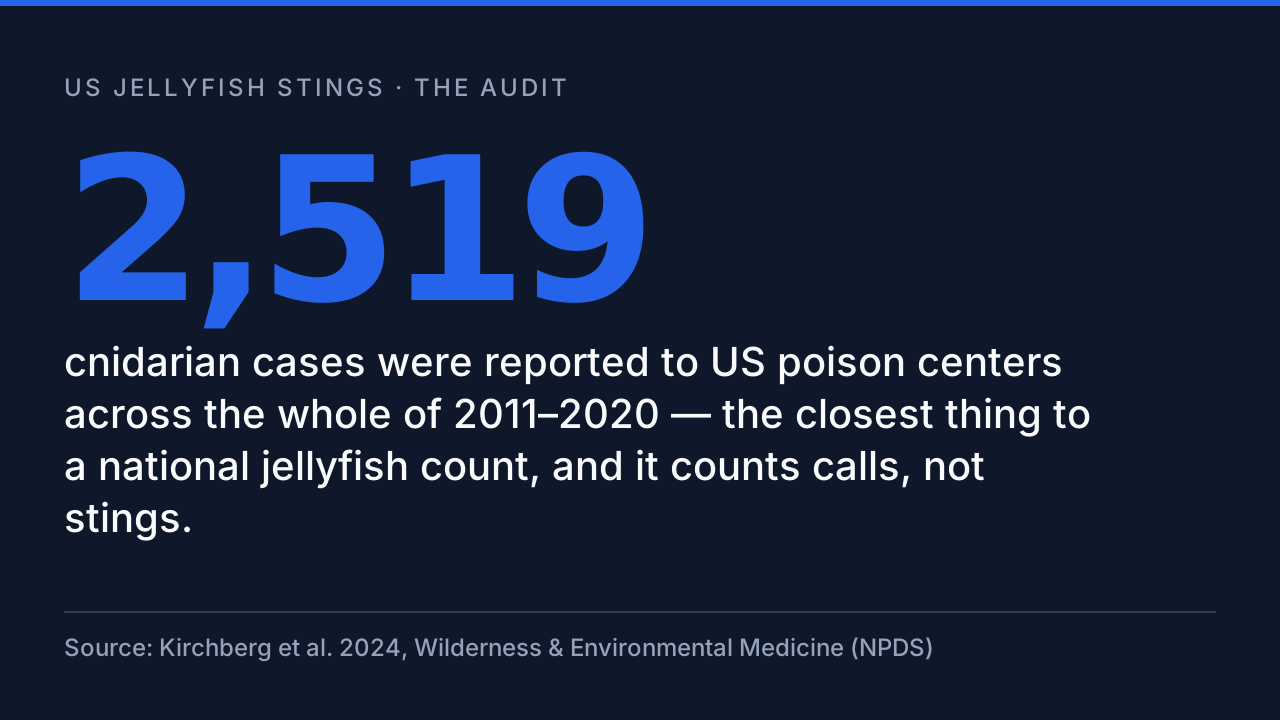
2,519
jellyfish and other cnidarian envenomations were reported to US poison centers across the whole of 2011–2020 — the closest thing to a national jellyfish count that exists, and it counts phone calls, not stings [reported, NPDS].
→ 150 million is the figure repeated worldwide as the number of jellyfish 'stings' each year. Traced, it comes from uncited 2004/2006 sentences about people exposed to jellyfish — no count, survey or method behind it has ever been published [contested]. (Boulware 2006, Journal of Travel Medicine, 2006)
Ask a search engine how many jellyfish stings happen in the United States each year and you will get a confident answer. The problem is that nobody counted. There is no national registry of jellyfish stings, no mandatory reporting rule, and no agency that publishes an annual US total. What exists instead is a patchwork of partial records — and one very famous number with no record behind it at all. This page is an audit of both.
First, the part that matters if you have just been stung. In the counted record below, most US jellyfish stings were painful but minor, and the large majority of reported cases never needed a hospital. But most is not all: a sting from a box jellyfish or a Portuguese man-o’-war, a sting to the face or eyes, or any sting followed by trouble breathing, chest pain, faintness, widespread swelling, or a child who seems unwell needs emergency care immediately — call 911. Our guide to jellyfish sting first aid: the first 10 minutes covers the immediate steps, the anaphylaxis warning signs after a sting page lists the symptoms that mean a reaction is turning dangerous, and if an auto-injector is ever used, our pages on when a second EpiPen dose is needed and what to do after using an EpiPen explain what happens next.
The closest thing to a national count is the National Poison Data System, the database behind America’s poison control centers: across the whole of 2011–2020 it holds 2,519(Kirchberg et al. 2024, Wilderness & Environmental Medicine (NPDS), 2020). Widen the lens to every marine animal and the decade’s total is 8,517 reports of all kinds (Kirchberg et al. 2024, Wilderness & Environmental Medicine (NPDS), 2020), averaging 852 a year, with 37% of cases treated in a healthcare facility. Local records tell the same story at a smaller scale — one Honolulu emergency department treated 116 jellyfish patients across eight and a half years and sent every one of them home. Set against that quiet record sit the loud estimates: half a million stings a year in a single bay, and a global figure of 150 million that dissolves, on inspection, into a sentence about people merely being exposed to jellyfish. Every number below wears the label of the system that produced it — [reported], [counted] or [estimated] — because in this topic, the label is the finding.
1 What the National System Counted: Poison-Center Reports, 2011–2020
The United States has no jellyfish sting registry. Its national record is the poison-center database: 2,519 across 2011–2020 [reported], inside 8,517 aquatic envenomation reports of every kind (Kirchberg et al. 2024, Wilderness & Environmental Medicine (NPDS), 2020) — a count of phone calls, not of stings.
METRIC
VALUE
SOURCE
Cnidaria share of all reported aquatic cases [reported]
Hawaii’s reported incidence dwarfs every other state’s — and the Honolulu record in the next section suggests why: most jellyfish patients at the city’s emergency department were visitors, not residents.
Kirchberg et al. 2024 (NPDS), 2020
Reported incidence per 100,000 residents
Hawaii reported incidence, decade total [reported, NPDS]
16.7
Florida reported incidence, decade total [reported, NPDS]
15.78
South Carolina reported incidence, decade [reported]
5.19
Average reported incidence, all states [reported]
2.8
Read the category name before the number. NPDS files these cases under generic code 231000, ‘Jellyfish and Other Coelenterate Stings’ — a bucket that also holds Portuguese man-o’-war, sea anemones, hydroids and fire coral. The cnidarian total is therefore an upper bound for jellyfish alone, not a jellyfish count. The callers skew young and male: 62% of patients were male and 56% were aged 30 or younger. And the record is heavily seasonal, with 46% of reports arriving in June, July and August, and July alone contributing 1,465.
Most callers never went near a hospital: 56.9% of cases were managed on site, 26.4% were already at, or on their way to, a healthcare facility when the call was made, and 13.4% were referred to one. Geography is just as lopsided. Florida produced the most reports of any state at 2,967, ahead of California’s 1,307 and Texas’s 623. Per person, though, Hawaii leads by a wide margin — an incidence of 16.7 per 100,000 residents across the decade, against a state average of 2.8 — a pattern the authors link to visitors, who make up most Hawaiian cases in the emergency-department record below. Along the Atlantic coast, summer incidence ran highest in the South Atlantic at 3.72 per 100,000, well ahead of the Mid-Atlantic at 1.49 and New England at 0.81. One more kind of noise the record cannot filter out: not every beach rash blamed on jellyfish is a sting at all — swimmer's itch produces a similar-looking rash with no jellyfish involved.
2 What Local Systems Counted: An Emergency Department, a State Series, Two Beach Patrols
Closer to the water, the records shrink but sharpen: 116 jellyfish patients at one Honolulu emergency department across 2000–2008, every one discharged home; 423 cases in the Texas poison-center series; and over 1,000 stings logged by a single Delaware beach patrol in the summer of 2026.
One patrol, one small state, one summer: a thousand-plus stings, logged by hand — and absent from every national dataset, because no national dataset asks.
Delaware News Journal, 16 Aug 2026, 2026
The typical Honolulu patient was young, with a median age of 24, and usually a visitor: 64% were Hawaii non-residents, in the water on holiday. Most arrived by ambulance (64%), most had normal vital signs (65%), and 64% received intravenous medication, with up to five different medications used in a single visit. Then comes the sentence that defines the series: every one of the 116 patients was discharged home from the ED. No admissions, no deaths — eight and a half years of jellyfish stings at a city hospital in prime box jellyfish water, and the outcome column is a row of home discharges.
Texas offers the only published state-level poison-center series for jellyfish specifically. Forrester counted 423 jellyfish sting cases reported to Texas poison centers between 1998 and 2004 (Forrester 2006, as reported by Healio, 2004), in a state with hundreds of miles of Gulf coastline; 52% of the patients were male. The caveat attached to the series in later commentary is the one that applies to every figure on this page: with no mandatory reporting, it is an undercount of unknown size. It is also, notably, a jellyfish series — the thing the national study does not publish.
The third kind of counter never publishes at all: the lifeguard’s logbook. In the summer of 2026, Delaware’s beaches gave a rare public glimpse of it. The Rehoboth Beach Patrol had logged 1,000 stings by mid-August (Delaware News Journal, 16 Aug 2026, 2026) — a level its captain described as unremarkable, about the same as previous years — and in a single three-day stretch that July, lifeguards at neighbouring Lewes treated 300(Delaware News Journal, 21 Jul 2026, 2026). One patrol, one summer, one small state: a thousand stings that appear in no national dataset, because no national dataset collects them. That gap — between what beach patrols see and what any system records — is exactly where the famous estimates live.
3 How the Counted Cases Ended: Outcomes, Severity and Deaths
The counted cases were overwhelmingly mild: poison centers recorded an outcome for 3,963 of reports, 71.8% of those outcomes were minor effects, major effects numbered 19 across the whole decade — and deaths in the national record numbered 0.
Zero deaths in a decade of national reporting. The figure deserves its size: jellyfish stings in the US are common and occasionally serious, but the counted record contains no fatal case at all.
Kirchberg et al. 2024, Wilderness & Environmental Medicine (NPDS), 2020
Poison centers recorded a medical outcome for 3,963 of the 8,517 reports. The cnidarian breakdown shows the shape of a typical reported sting: 801 cases ended minor and 254 moderate. Across all aquatic reports, the commonest recorded problems were skin-deep: dermal irritation and pain in 65.2% of cases, and a puncture wound or sting in 63.9%. Most patients who reached care went home — 2,167 were treated, evaluated and released, against 218 admitted to a ward and 63 admitted to critical care.
The exception deserves its own paragraph, because rare must never be read as impossible. The decade’s most serious cnidarian case was 1: a 26-year-old man who developed metabolic acidosis, electrolyte abnormalities, renal failure and respiratory depression, and who was intubated and ventilated in intensive care. He is the reason this page puts its emergency guidance at the top rather than treating severity as a footnote. On deaths, the historical Atlantic record is nearly as empty as the modern one — a 2009 review of Atlantic cnidarian envenomations counted 5 proven fatalities across the two decades from 1980 to 2000, two of them in Florida (Burnett 2009, Toxicon (review of Atlantic cnidarian envenomations), 2000). If you are reading this after a sting, the practical pages matter more than the statistics: know the emergency signs after a sting, how to tell a large local reaction from anaphylaxis, when sting swelling becomes an emergency, why a delayed allergic reaction can still appear hours later, and when any sting becomes an emergency.
4 The Estimates That Were Never Counts
The most repeated American figures come from a single sentence in a 2006 sting-inhibitor trial: 500,000 are estimated to occur in Chesapeake Bay, and up to 200,000 in Florida waters annually (Burnett 1992, Md Med J, as cited in Boulware 2006, 1992). The citation behind both numbers is one 1992 review in the Maryland Medical Journal by Joseph Burnett, the era’s leading jellyfish researcher. Neither paper publishes a counting method, a survey or a dataset behind the figures — and the 2024 poison-center study repeats the Chesapeake estimate, citing the same 1992 paper, which tells you how thin the shelf is: three decades on, there is still nothing newer to cite. Travel and snorkel sites now print the Florida figure as current fact.
Half a million stings a year in one bay — an estimate older than most of the swimmers it describes, still in circulation, still without a counting method behind it.
Burnett 1992, Md Med J, as cited in Boulware 2006, 1992
Set the estimates beside the largest counted American episode in the literature. In July 1997, a box jellyfish influx at Waikiki Beach stung 800 in two days (Thomas et al. 2001, Hawaii Medical Journal, as reported in Boulware 2006, 1997) — a genuine mass event, the kind that closes beaches and fills emergency departments, and it is counted in hundreds. For the Chesapeake estimate to hold, the equivalent of that Waikiki weekend would have to unfold in one bay system roughly every day, unrecorded. Estimates are not lies; they are guesses about a denominator nobody measures. What the trial paper does offer is a measured denominator of a different kind: in 2002, 48 million Americans swam in salt water. Exposure on that scale makes large sting totals conceivable — it does not make them counted. And where an institution does count, the totals look like Australia’s: lifesavers there logged 19,277 marine stings in a single year, with about 50 hospitalizations annually from severe envenomations — real numbers, produced by logbooks, for a coastline with far more dangerous species than America’s. One last caution for beachgoers: not every painful beach bite is a jellyfish — stable flies bite on beaches too, and their bites enter no sting statistic either.
5 150 Million: The Audit
Search ‘how many jellyfish stings per year’ anywhere and one number answers: 150 million(commonly cited; no primary source traceable). Follow the citations and they converge on a 2006 randomized field trial of a topical sting inhibitor, Safe Sea, by David Boulware. The trial’s abstract does say it — 150 million(commonly cited; no primary source traceable) ‘envenomations annually’ (Boulware 2006, Journal of Travel Medicine (abstract), 2006). But turn to the paper’s own introduction and the sentence changes: 150 million — people exposed rather than envenomations, and the sentence carries no citation at all, in a paragraph where the neighbouring claims carry references.
DOCUMENT
THE FIGURE AS PRINTED
SOURCE
Boulware 2006, abstract — ‘envenomations’
150 million(commonly cited; no primary source traceable)
Nor was 2006 the start. Two years earlier, the same product’s laboratory trial — Kimball and colleagues, 2004 — had printed the same sentence, also without a citation: 150 million(Kimball et al. 2004, Wilderness & Environmental Medicine, 2004). That paper’s funding footnote records support, in part, from a grant to Nidaria Technology Ltd — the company that made the sting-inhibitor lotion both trials were evaluating. None of this makes the trials’ sting-prevention results wrong. It means the 150-million figure entered the literature as background colour in papers connected to a product; it was never a measurement, and it was never anyone’s research result.
From there, the wording did the travelling. A 2022 review in the International Journal of Environmental Research and Public Health restated the figure as 150 million — cnidarian envenomations, dated ‘around 2006’ (Cunha & Dinis-Oliveira 2022, Int J Environ Res Public Health, 2022). By 2025, reviews in Marine Drugs were printing it as 150 million — jellyfish stings, credited to Boulware (Marine Drugs 2025 review (Jellyfish Venom-Induced Cardiotoxicity), 2025) — a claim Boulware’s text never made. At the consumer end of the chain, an education page now repeats the figure while admitting, in effect, that it amounts to 150 million — and prints it anyway (StudyCountry.com, 'How common are jellyfish stings?' (accessed 2026-11-13), 2026). Exposed became envenomated became stung; a guess became a fact by citation. The companion numbers show where the documented harm actually sits: the same 2006 introduction attributes 67 deaths to box jellyfish in the Indo-Pacific — real, counted tragedies, in a different ocean from the American record of effectively zero.
So what should replace the famous number? For the United States, the honest answer is the one this audit started with: unknown — bounded below by 2,519 of poison-center reports that certainly undercount, shadowed by patrol logs like Delaware’s that suggest far more, and not honestly estimable from anything published. A total invented here would simply be one more uncited number for the chain. This page will update if a real national count ever exists. Until then, the counted record above is the whole story — and it is enough: jellyfish stings in America are common, occasionally serious, very rarely critical, and, across ten years of national reporting, never once recorded as fatal.
Key statistics at a glance | Source: see numbered sources below
Explore every figure in this article
Metric
Value
Year
Source
Cnidaria share of reported aquatic cases [reported, NPDS]
This page was built with the DataGap Method: an audit that joins the United States’ separate counting systems for jellyfish and other cnidarian stings — the National Poison Data System analysis for 2011–2020, a Honolulu emergency-department chart review, the Texas poison-center series and 2026 Delaware beach-patrol logs — and sets them against the estimate literature, tracing the ‘150 million stings’ figure through its citing papers to its 2004 and 2006 print origins. Every figure carries the label of its system: [reported] for voluntary poison-center calls, [counted] for chart reviews and patrol logs, [estimated] for figures with no counting system behind them. Figures were never summed across systems or periods, and no national or global total was calculated, because none exists in any source. Two slips in the main source are disclosed rather than silently tidied: its abstract and results text differ slightly on the healthcare-facility count (this page uses the abstract’s figure), and its prose misprints the major-effect share that its own table gives as 0.2%. The NPDS 2024 annual report’s jellyfish column was deliberately not used — the publisher PDF’s table text could not be aligned to its columns with certainty, and an audit does not guess. Degraded stages, named honestly: demand was unmeasured in Stage 1 because the public data sources were unreachable from the research host; the Stage 3 format filter did not run; the Stage 6a recency sweep ran in degraded mode and was completed with manual web searches; the Stage 4 existence gate was run manually against a fresh 690-URL sitemap corpus; and the visuals are locally drawn charts, not generated imagery.
Sources consulted: 24
Sources cited: 11
Data freshness: current year: 3, last year: 1, older: 7
Data range: 1992-01-01 to 2026-11-13
Research date: 2026-11-13
Update schedule: Annual, when a new NPDS analysis or annual-report table can be read reliably
Limitations: No US system counts jellyfish stings: the National Poison Data System records voluntary calls, and its jellyfish category (generic code 231000) also covers Portuguese man-o'-war, sea anemones, hydroids and fire coral, so cnidarian figures are an upper bound for jellyfish alone. NPDS state counts cover all aquatic envenomations because the national study publishes no jellyfish-only state table. The Kirchberg paper's abstract (3,151) and results text (3,169) differ slightly on the healthcare-facility count; this page uses the abstract's figure. The paper's prose also prints 0.002% beside its 19 major effects; its Table 3 prints 0.2%, which is used here. The NPDS 2024 annual report's jellyfish column was deliberately not used: the publisher PDF's table text could not be aligned to its columns with certainty, and this page does not guess. The 1992 Chesapeake Bay and Florida estimates are carried as estimates from a source whose full text is not openly available; they are attributed through the papers that cite them.
Frequently Asked Questions
How many jellyfish stings happen in the United States each year?
Nobody knows, because no US system counts them. The closest national record is the poison-center database: it logged 2,519 jellyfish and other cnidarian cases across the entire decade 2011–2020 — about 252 reports a year. That counts voluntary phone calls, not stings, and the researchers who published it warn it undercounts, especially mild cases. There is no registry, no mandatory reporting and no national total. (Kirchberg et al. 2024, Wilderness & Environmental Medicine (NPDS), 2020)
Where does the '150 million jellyfish stings a year' figure come from?
It traces to two papers evaluating a commercial sting-inhibitor lotion. Kimball et al. (2004) wrote that 'over 150 million people are exposed to jellyfish annually'; Boulware (2006) repeated the sentence about people exposed, while his abstract reworded it as '150 million envenomations annually'. Neither sentence carries a citation or a method. Later reviews cite Boulware and print it as '150 million jellyfish stings' — a wording the original never used. (Boulware 2006, Journal of Travel Medicine; Kimball et al. 2004, Wilderness & Environmental Medicine, 2006)
Is it true that 500,000 people are stung in Chesapeake Bay every year?
That figure is an estimate, not a count. It comes from a 1992 review by jellyfish researcher Joseph Burnett in the Maryland Medical Journal, and it is still repeated today — including by the 2024 poison-center study — without any published counting method. For scale, the entire national poison-center record holds about 252 cnidarian reports a year. The two numbers measure different things: an estimate of every contact in a whole estuary versus phone calls about the cases that worried someone. (Burnett 1992, as cited in Boulware 2006 and Kirchberg et al. 2024, 1992)
How many people die from jellyfish stings in the United States?
In the counted record, almost none. Poison centers recorded zero deaths among 8,517 aquatic envenomation reports in 2011–2020, and a 2009 review found only five proven jellyfish fatalities in the entire Atlantic region across 1980–2000. Rare is not the same as impossible: a sting followed by trouble breathing, chest pain, faintness or widespread swelling is an emergency — call 911 and get emergency care immediately. (Kirchberg et al. 2024 (NPDS); Burnett 2009, Toxicon, 2020)
Which state has the most jellyfish stings?
In the poison-center record, Florida generated the most reports of any state — 2,967 aquatic envenomation reports in 2011–2020 — while Hawaii had the highest rate relative to its population, at 16.7 reports per 100,000 residents across the decade. Those figures cover all aquatic envenomations (fish stings included), because the national study does not publish a jellyfish-only state table; they count reports, not stings. (Kirchberg et al. 2024, Wilderness & Environmental Medicine (NPDS), 2020)
Why are the poison-center numbers so much lower than the estimates?
Because they count different funnels. The National Poison Data System only records cases someone phoned in. The 2024 study's authors note it excludes people who never sought care and cases treated by clinicians who never called a poison center — and that lifeguards and coastal clinicians who handle stings routinely may not call at all. Most reported cases were mild: 56.9% were managed on site. The estimates, by contrast, try to guess every contact, including stings shaken off on the sand. (Kirchberg et al. 2024, Wilderness & Environmental Medicine (NPDS), 2020)
When do most US jellyfish stings happen?
In the poison-center record, summer dominates: 46% of all aquatic envenomation reports in 2011–2020 arrived in June, July and August, with July the single biggest month at 1,465 reports (17.2%). The pattern matches warm water, jellyfish bloom season and peak swimming. Local surges can still overwhelm a single beach — Waikiki saw more than 800 people stung in two days during a July 1997 box jellyfish influx. (Kirchberg et al. 2024 (NPDS); Thomas et al. 2001 via Boulware 2006, 2020)
Sources & References
Kirchberg TN, Cantrell FL, Coffey CH, Tomaszewski C — Wilderness & Environmental Medicine. “Nationwide Aquatic Envenomations Reported to US Poison Control Centers from 2011 to 2020. Wilderness Environ Med 2024;35(1):22–29. DOI 10.1177/10806032231223016.” artefacts-discovery.researcher.life/full_text/DA-2/26/26f82595647d3e60a5210480b2. Accessed 2026-11-13.
Ping J, Onizuka N — Hawaii Medical Journal. “Epidemiology of Jellyfish Stings Presented to an American Urban Emergency Department. Hawaii Med J 2011;70(10):217–219.” pmc.ncbi.nlm.nih.gov/articles/PMC3215982/. Accessed 2026-11-13.
Forrester MB — Human & Experimental Toxicology (as reported). “Epidemiology of Jellyfish Stings Reported to Poison Centers in Texas. Hum Exp Toxicol 2006;25(4):183–186 — total and the no-mandatory-reporting caveat as reported in Healio's Pediatric Annals case commentary.” healio.com/news/pediatrics/20120325/a-teenage-girl-returning-from-spring-break. Accessed 2026-11-13.
Boulware DR — Journal of Travel Medicine. “A Randomized, Controlled Field Trial for the Prevention of Jellyfish Stings With a Topical Sting Inhibitor. J Travel Med 2006;13(3):166–171.” pmc.ncbi.nlm.nih.gov/articles/PMC1965592/. Accessed 2026-11-13.
Kimball AB, Arambula KZ, Stauffer AR, et al. — Wilderness & Environmental Medicine. “Efficacy of a Jellyfish Sting Inhibitor in Preventing Jellyfish Stings in Normal Volunteers. Wilderness Environ Med 2004;15:102–108.” sciencedirect.com/science/article/pii/S1080603204704548. Accessed 2026-11-13.
Cunha SA, Dinis-Oliveira RJ — International Journal of Environmental Research and Public Health. “Raising Awareness on the Clinical and Forensic Aspects of Jellyfish Stings: A Worldwide Increasing Threat. Int J Environ Res Public Health 2022;19:8430.” mdpi.com/1660-4601/19/14/8430/pdf. Accessed 2026-11-13.
Marine Drugs review — Jellyfish Venom-Induced Cardiotoxicity and Immune Responses. “Jellyfish Venom-Induced Cardiotoxicity and Immune Responses: Mechanisms and Potential Therapeutic Strategies. Mar Drugs 2025;23:369.” pmc.ncbi.nlm.nih.gov/articles/PMC12565744/. Accessed 2026-11-13.
StudyCountry.com. “How common are jellyfish stings? (consumer page repeating the 150-million figure while stating its origin is unclear).” studycountry.com/wiki/how-common-are-jellyfish-stings. Accessed 2026-11-13.
Last updated:
This article is for informational purposes only and isn’t medical advice. If you’re worried about a bite or sting, talk to a healthcare professional.
SJ
Dr. Sarah Jones, MD
MD — Medical Reviewer · Board-Certified Emergency Medicine Physician
Dr. Jones oversees StingHelp’s clinical verification process. Every guide is systematically evaluated against active Centers for Disease Control and Prevention (CDC), Environmental Protection Agency (EPA), and American Academy of Allergy, Asthma & Immunology (AAAAI) medical consensus standards to ensure symptom distinctions and care recommendations are clinically sound.
How this guide was prepared: Researched and structured by the StingHelp Editorial Team; verified against peer-reviewed dermatology literature; clinically reviewed November 2026.
RELATED CLINICAL GUIDES
More StingHelp guides
Explore physician-reviewed first-aid procedures, identification clues, and symptom comparisons for other common outdoor bites and stings.
Poison centers logged 185,402 US scorpion reports in 2005–2015, yet a 2025 study estimates 178,625 stings in one Arizona county in five years. Every count and every antivenom price — $100 to $39,652 a vial — with its system, year and label.
Every October, the same scene plays out in houses across the country: black-and-reddish bugs appear on sunny windows, gather on siding, and slip through…
STAY INFORMED
Keep practical guidance close.
Seasonal bite forecasts, updated first-aid protocols, and evidence-based outdoor prevention tips delivered to your inbox.
Your information is handled under our Privacy Policy. For urgent symptoms, seek medical help rather than waiting for an email response.