
Can Ticks Live in Your House? Indoor Survival Facts
Introduction: The Direct Answer Yes, ticks can survive inside a house, but most tick species do not live indoors the way fleas or bed…
How many people test positive for alpha-gal, state by state: laboratory suspected cases, blood-donor seroprevalence, state-reported positives and health-record diagnoses — each figure labelled with the counting system that produced it.
Source: CDC MMWR 2026 (Saunders et al.) (2025)
Ask how many people test positive for alpha-gal and you will collect at least four different answers, each of them accurate — and none of them interchangeable. The numbers come from different counting systems that were built for different purposes: a commercial laboratory’s test results, a blood-donor study, state health departments, and hospital record systems. This page lines the systems up side by side, labels every figure with the system that produced it, and refuses to add their outputs together. It is a page about the data, not the condition itself — for what alpha-gal syndrome is and how it is managed, see StingHelp's alpha-gal syndrome explainer. One safety note before the tables: alpha-gal reactions are delayed by hours and can occasionally be severe, so anyone who develops symptoms after eating mammalian meat should raise it with a clinician rather than self-diagnosing from a number on this page — and should know the warning signs of a severe allergic reaction.
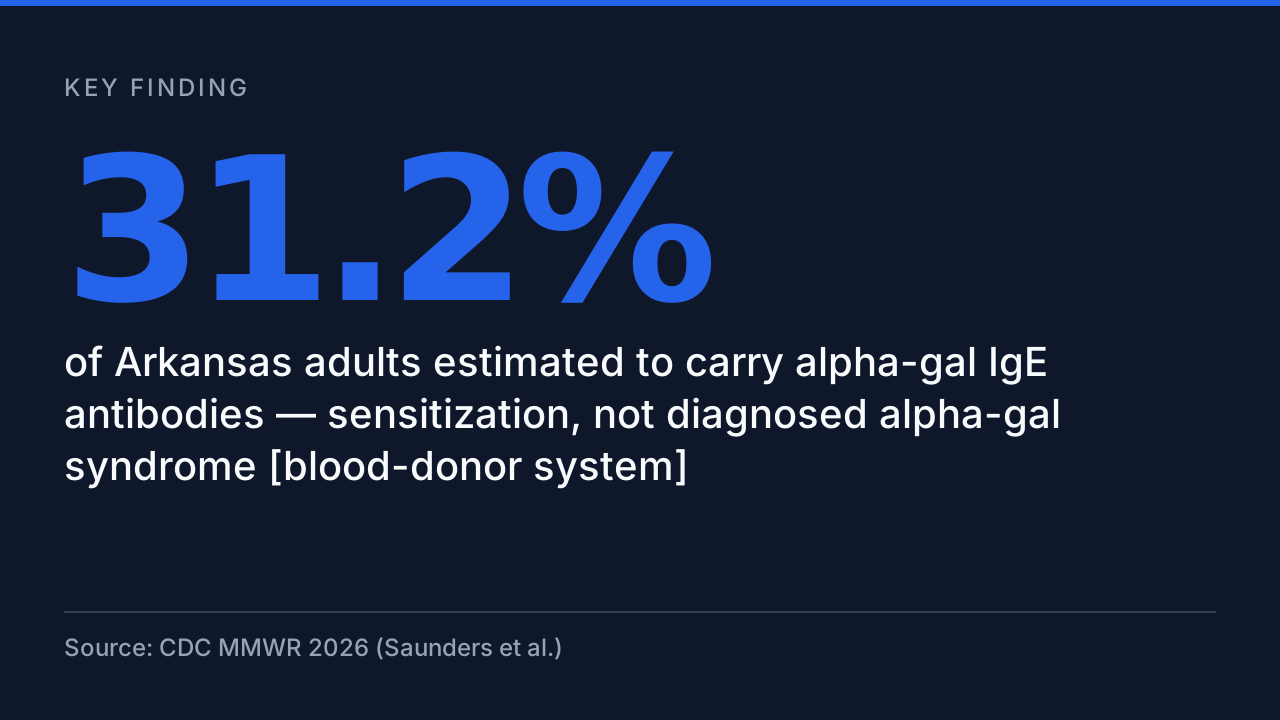
Start with the widest gap. In CDC’s blood-donor study, an estimated 31.2% of Arkansas adults carry alpha-gal IgE antibodies (CDC MMWR 2026 (Saunders et al.), 2025), and the combined estimate across the five highest states is 24.0% (CDC MMWR 2026 (Saunders et al.), 2025). Yet the clinical estimate for the whole country is that up to 450,000 people may actually have the syndrome (CDC MMWR 2026 (Saunders et al.), 2022). Between those two figures sits the central fact of alpha-gal data: carrying the antibody (sensitization) and having the allergy (the syndrome) are different sets, and every counting system captures a different one of them.
Each section below is one system, with its own table: who it counts, over what period, and what its numbers can and cannot support. Where a figure comes from a secondary report rather than the primary paper, the source column says so. Nothing here is medical advice, and no figure here can tell an individual reader whether they have alpha-gal syndrome — only a clinician who knows their history can do that.
The laboratory system counts people whose clinicians ordered an alpha-gal IgE test. Between the start of the study window and its end, 357,119 tests were submitted, covering 295,400 people, and 90,018 of them — 30.5% — received a positive result (CDC MMWR 2023 (Thompson et al.), 2022). Because no symptom information accompanied the tests, the study classifies every one of those positives as a suspected case, not a confirmed one.
| METRIC | VALUE | SOURCE |
|---|---|---|
| Tests submitted, full study window | 357,119 | CDC MMWR 2023 (Thompson et al.) |
| Persons tested | 295,400 | CDC MMWR 2023 (Thompson et al.) |
| Persons who tested positive (suspected cases) | 90,018 | CDC MMWR 2023 (Thompson et al.) |
| Share of tested persons who were positive | 30.5% | CDC MMWR 2023 (Thompson et al.) |
| Positive persons, first study year | 13,371 | CDC MMWR 2023 (Thompson et al.) |
| Positive persons, peak year | 18,885 | CDC MMWR 2023 (Thompson et al.) |
| Persons tested, peak year | 66,106 | CDC MMWR 2023 (Thompson et al.) |
| Suspected cases, earlier study window | 34,000 | CDC MMWR 2023 (Thompson et al.), citing Binder et al. 2021 |
| Highest-count county — Suffolk County, NY | 3,746 | News-Medical summary of CDC MMWR 2023 county data |
| Bedford County, VA — suspected cases | 1,511 | News-Medical summary of CDC MMWR 2023 county data |
Two design facts explain the shape of this table. First, until August of the study’s fifth year, Eurofins Viracor performed nearly all alpha-gal testing in the United States, so this dataset is close to a census of the country’s clinical testing — and also a record of one company’s order book, which grows as clinician awareness grows. (The testing exists because of the tick connection; the mechanism is covered in the alpha-gal tick-bite explainer.) Second, the study defined a suspected case as a positive test with no clinical information attached. The label is honest: nobody checked whether these people had symptoms.
The internal patterns are consistent with a test ordered on suspicion. Men were a minority of those tested but tested positive at 42% against 24% for women (CDC MMWR 2023 (Thompson et al.), 2022), and positivity climbed with age to 44.6% among the oldest group (CDC MMWR 2023 (Thompson et al.), 2022). Geographically, suspected cases concentrated in the southern, midwestern and mid-Atlantic counties inside the lone star tick’s range — the same map as ehrlichiosis, another lone-star-borne disease. Across both CDC laboratory studies, the cumulative tally reached 110,229 suspected cases (New York Times, reporting CDC MMWR 2023, 2022) — the figure most headlines shorten to ‘cases’, dropping the word ‘suspected’ on the way.
The donor system asks the opposite question: not ‘of the people tested, how many were positive?’ but ‘of everyone, how many carry the antibody?’ Researchers tested 3,000 blood donors across ten states, regardless of symptoms, and 592 were positive (CDC MMWR 2026 (Saunders et al.), 2025). Weighted to each state’s adult population, sensitization runs from the hero figure in Arkansas down to 1.1% in Washington (CDC MMWR 2026 (Saunders et al.), 2025) — a thirty-fold spread between states.
| METRIC | VALUE | SOURCE |
|---|---|---|
| Five highest states combined | 24.0% | CDC MMWR 2026 (Saunders et al.) |
| Arkansas | 31.2% | CDC MMWR 2026 (Saunders et al.) |
| Missouri | 26.0% | CDC MMWR 2026 (Saunders et al.) |
| Virginia | 22.8% | CDC MMWR 2026 (Saunders et al.) |
| Kentucky | 22.7% | CDC MMWR 2026 (Saunders et al.) |
| Tennessee | 21.5% | CDC MMWR 2026 (Saunders et al.) |
| Maine | 10.6% | CDC MMWR 2026 (Saunders et al.) |
| South Carolina | 5.5% | CDC MMWR 2026 (Saunders et al.) |
| Minnesota | 5.4% | CDC MMWR 2026 (Saunders et al.) |
| New Mexico | 1.9% | CDC MMWR 2026 (Saunders et al.) |
| Washington | 1.1% | CDC MMWR 2026 (Saunders et al.) |
Read these percentages as estimates with a method attached, not as counts. Each state rests on three hundred donors, weighted to match the state’s adult population by age and sex; blood donors skew older, healthier and whiter than the general public, and the authors flag that donor blood-type mix may push estimates slightly upward. The demographic pattern inside the study echoes the laboratory data: estimated seroprevalence reached 25.8% in the oldest age band against 8.7% in the youngest (CDC MMWR 2026 (Saunders et al.), 2025), and 18.5% in men against 12.4% in women (CDC MMWR 2026 (Saunders et al.), 2025). The geography is the lone star tick’s geography — background on lone star tick bite symptoms and on how attachment time drives tick-borne transmission fills in why exposure concentrates where it does.
The study’s own discussion supplies the conversion evidence the other systems lack. In a North Carolina case-control study, 63 control participants carried alpha-gal IgE and not one of them had the syndrome (CDC MMWR 2026, reporting Kersh et al. 2023, 2023). The authors’ conclusion follows directly: with population seroprevalence this high and clinical syndrome comparatively rare, the test should be used for patients whose history fits — a point the final section takes up. Sensitization is best read as exposure recorded by the immune system, not as illness waiting to be counted.
State systems count what laboratories and clinicians are required or asked to send them — which means their totals start when the counting starts. Virginia made alpha-gal syndrome reportable on September 24, 2025 (Virginia Department of Health, clinician letter on reportable-disease regulation changes, 2025), and within roughly its first half-year of tracking the state had counted 8,482 residents with positive tests (New York Times, reporting Virginia Department of Health figures, 2026). Maine, running surveillance without a mandate, spent a decade assembling a far smaller file — and then reviewed it clinically.
| METRIC | VALUE | SOURCE |
|---|---|---|
| Date reporting began — Virginia | September 24, 2025 | Virginia Department of Health, clinician letter on reportable-disease regulation changes |
| Positive tests counted — Virginia, first tracking period | 8,482 | New York Times, reporting Virginia Department of Health figures |
| Residents identified via lab reports — Maine, full period | 57 | Emerging Infectious Diseases 2025 (Saunders et al., Maine CDC) |
| Confirmed after clinical review — Maine | 23 | Emerging Infectious Diseases 2025 (Saunders et al., Maine CDC) |
| Remained suspected after review — Maine | 34 | Emerging Infectious Diseases 2025 (Saunders et al., Maine CDC) |
Virginia shows what a reporting switch does to a count. Nothing about the allergy changed on the day the regulation took effect; what changed is that positive results began flowing to the health department by law, and a state that previously could not say how many residents tested positive suddenly accumulated thousands. Any future Virginia trend line has to be read against that start date — early growth in the tally is the system switching on, not an outbreak. The New York Times, reporting the department’s figures, calculated the pace at roughly fifty positive tests a day.
Maine shows the other half of state counting: what happens after the lab report lands. Reviewers worked through the 57 residents identified from positive lab reports and could confirm only 23 of them (Emerging Infectious Diseases 2025 (Saunders et al., Maine CDC), 2023); the remaining 34 stayed suspected, mostly because the charts lacked the symptom-timing detail the case definition requires (Emerging Infectious Diseases 2025 (Saunders et al., Maine CDC), 2023). That forty-per-cent conversion is, at the time of writing, the only published worked example of the funnel from positive test to confirmed case — and it is the strongest single argument against reading any raw positive count as a case count. For readers who find a tick on themselves, the practical sequence is in the first 24 hours after a tick bite — testing decisions come later, and belong with a clinician.
The fourth system reads diagnoses that clinicians wrote into medical records. In a network of 114,696,176 patients (Cureus 2025 (Ross et al., TriNetX), 2025), coded mammalian-meat-allergy diagnoses were almost invisible in the first window — 180 new diagnoses across six years — then rose to 10,132 in the second window (Cureus 2025 (Ross et al., TriNetX), 2025), a 5,520% rise in incidence proportion (Cureus 2025 (Ross et al., TriNetX), 2025). It is the only system that requires a clinician to commit to a diagnosis, and the only one whose baseline is essentially zero.
| METRIC | VALUE | SOURCE |
|---|---|---|
| Patients in the record network | 114,696,176 | Cureus 2025 (Ross et al., TriNetX) |
| New diagnoses, first window | 180 | Cureus 2025 (Ross et al., TriNetX) |
| New diagnoses, second window | 10,132 | Cureus 2025 (Ross et al., TriNetX) |
| Rise in incidence proportion between windows | 5,520% | Cureus 2025 (Ross et al., TriNetX) |
The near-zero baseline is the tell. A network covering a third of the US population recorded almost no coded diagnoses in the first window not because the allergy was absent — the laboratory data shows tens of thousands of positive tests in those same years — but because clinicians rarely recognised the condition and the code was rarely used. The curve that follows is therefore an awareness curve wearing an incidence curve’s clothes, and the study’s authors concede the single code can cut both ways, missing real cases and sweeping in unconfirmed ones.
This system’s numbers also cannot be compared head-to-head with the laboratory section’s. The denominator here is everyone in the network, sick or not; the laboratory denominator is only people a clinician already suspected. A small number here and a large number there are both compatible with the same underlying reality — which is precisely why this page keeps the systems in separate tables instead of merging them into one impressive, meaningless total.
Placed side by side, the headline figures stop contradicting each other once each is read with its label: 110,229 suspected cases from the laboratory system (New York Times, reporting CDC MMWR 2023, 2022), an estimated 450,000 people affected from the model, and sensitisation shares above twenty per cent from the donor study. They describe nested sets — everyone exposed, everyone tested, everyone positive, everyone actually ill — and the sets shrink at every step. The threshold all of them share is 0.1 kU/L (CDC MMWR 2026 (Saunders et al.), stating the CSTE 2022 case definition, 2022); what differs is everything built on top of it.
| METRIC | VALUE | SOURCE |
|---|---|---|
| Cumulative suspected cases — laboratory system | 110,229 | New York Times, reporting CDC MMWR 2023 |
| Modelled estimate of people affected — ceiling | 450,000 | CDC MMWR 2026 (Saunders et al.) |
| That estimate as a share of the US population | 0.14% | CDC MMWR 2026 (Saunders et al.) |
| Positive-test threshold shared by all systems | 0.1 kU/L | CDC MMWR 2026 (Saunders et al.), stating the CSTE 2022 case definition |
The hinge is the case definition. Under the CSTE definition both MMWR studies use, a positive result at the shared threshold plus clinically compatible symptoms makes a confirmed case; the same result with no clinical information makes only a suspect case. Every system above the line in this article stops at the laboratory door — which is why CDC’s guidance, restated in the donor study, is that testing belongs to patients whose history fits the syndrome. At a population sensitisation level of 24.0%, testing the merely curious mostly manufactures positives, and the study warns that overdiagnosis leads to dietary restrictions people never needed. Whether to test, and what a result means, is a decision to make with your own clinician — particularly since reactions are typically delayed by hours, a pattern described in alpha-gal symptoms hours after eating red meat, which is one reason cases hide from every system on this page.
What a reader can legitimately take from the tables is narrower and more useful than a single national number: in tick-heavy states, exposure is common and confirmed illness is far less common; counts are rising fastest where counting is newest; and the only honest national statement is a range with labels attached. The lever every source agrees on is upstream of all four systems — fewer lone star tick bites. That means removing an attached tick safely and promptly when one is found, and building tick checks into outdoor routines like the ones in the hiking tick safety checklist. Prevention shrinks every row in every table above; no change in counting ever will.


How this page was built, including what did not work. The figures were assembled on 13 November 2026 from the primary publications listed in the sources, using the Data Gap Method. Four stages of that method ran degraded and are named here: Stage 1 demand for this topic was unmeasured (no countable forum-thread demand was recorded for the cluster, so the topic rests on the Stage 2 search-evidence instead); the Stage 3 backlink format filter did not run, because no backlink API is available on this setup, and scoring used the documented fallback instead; the Stage 6 recency sweep was degraded — its Reddit leg was blocked (HTTP 403), its video and web legs were unavailable without an API key, and a manual web search was used in their place; and the existence gate was run manually over the site’s 689-URL sitemap corpus because the vendor’s checker does not run on this host. One source, the New York Times, blocked the automated fact-checker (403); its two figures were confirmed by reading the article directly, which the methodology records rather than hides. All charts were drawn locally from the fact sheet; no image-generation service was used. One figure was deliberately excluded: a Missouri Medicaid range (7,300–34,400 residents) reported by a single local newspaper — a single secondary source was not enough for a table whose entire value is provenance. Alpha-gal syndrome is not nationally notifiable in the United States, so no system counts confirmed cases nationwide; that absence is the reason this page exists in this shape.
In the largest laboratory dataset, 90,018 of 295,400 people tested between 2017 and 2022 received a positive alpha-gal IgE result, and CDC's combined laboratory studies identified 110,229 suspected cases across 2010–2022. These are positive tests in people whose clinicians suspected the condition — not a count of confirmed illness, and not a population rate. (CDC MMWR 2023 (Thompson et al.), 2022)
No. A positive test shows sensitization — your immune system carries alpha-gal IgE antibodies. Alpha-gal syndrome requires compatible symptoms as well. When Maine's health department reviewed 57 people identified through positive lab reports, only 23 met the confirmed case definition. CDC notes that only a small minority of seropositive people have the syndrome. If you have symptoms, a clinician can judge whether they fit; a lab value alone cannot. (Emerging Infectious Diseases 2025 (Saunders et al., Maine CDC), 2023)
By population share, Arkansas: an estimated 31.2% of adults there carry alpha-gal IgE antibodies, per CDC's 2024–2025 blood-donor study, followed by Missouri at 26.0%. By raw suspected-case counts in the 2017–2022 laboratory data, the highest-count county was Suffolk County, New York, with 3,746 suspected cases. The two rankings measure different things — sensitization share versus testing volume. (CDC MMWR 2026 (Saunders et al.), 2025)
Because each number comes from a different counting system. The 110,229 figure counts suspected cases found in laboratory data (2010–2022). The 450,000 figure is CDC's modelled estimate of everyone who might be affected, including people never tested. The 1-in-4 figure (24.0%) is the share of adults sensitized in the five highest states in a blood-donor study — antibodies, not illness. The numbers describe different sets and cannot be added or swapped. (CDC MMWR 2026 (Saunders et al.), 2025)
The Virginia Department of Health counted 8,482 residents with positive alpha-gal tests between the start of tracking in September 2025 and early March 2026, as reported by the New York Times — about 50 positive tests a day. Virginia made alpha-gal syndrome reportable on September 24, 2025, and laboratories must report positive results, so this tally grows by design: it measures reported positive tests, not confirmed cases. (New York Times, reporting Virginia Department of Health figures, 2026)
Not nationally — there is no US-wide case registry, which is why the national numbers come from laboratory and research data instead. A minority of states have added it to their own lists: Virginia's reporting requirement took effect September 24, 2025, and more than a dozen states now track positive alpha-gal blood tests in some form, according to the New York Times. Maine ran surveillance in 2014–2023 without a reporting mandate. (Virginia Department of Health, clinician letter on reportable-disease regulation changes, 2025)
CDC's 2026 MMWR advises that testing be reserved for patients whose history and symptoms are clinically compatible with alpha-gal syndrome — because in the highest-prevalence states, 24.0% of adults would test positive, most of them without the syndrome. Testing people without symptoms mostly counts sensitization and can lead to dietary restrictions nobody needed. Whether testing makes sense for you is a decision to make with your own clinician. (CDC MMWR 2026 (Saunders et al.), 2025)
Last updated:
This article is for informational purposes only and isn’t medical advice. If you’re worried about a bite or sting, talk to a healthcare professional.
Dr. Jones oversees StingHelp’s clinical verification process. Every guide is systematically evaluated against active Centers for Disease Control and Prevention (CDC), Environmental Protection Agency (EPA), and American Academy of Allergy, Asthma & Immunology (AAAAI) medical consensus standards to ensure symptom distinctions and care recommendations are clinically sound.
Explore physician-reviewed first-aid procedures, identification clues, and symptom comparisons for other common outdoor bites and stings.

Introduction: The Direct Answer Yes, ticks can survive inside a house, but most tick species do not live indoors the way fleas or bed…

# Are Ticks Active in Winter? Most people pack away their tick precautions along with the camping gear. Once the first hard frost arrives,…

You come in from a hike, a camping trip, or an afternoon of yard work, and your first instinct is to hop in the…