
Fire Ants on Youth Sports Fields: Kids’ Safety Guide
Every fall, millions of kids take the field for soccer, football, and baseball across the southern US — and many of those fields sit…
The famous 14-million-stung-a-year figure is a year-2000 estimate that was never re-measured. This page dates every fire ant number: the 2025 measured anaphylaxis prevalence, the 1989 death survey, and the 1998 treatment survey.
Source: McMurray et al., Frontiers in Allergy (2025) (2023)
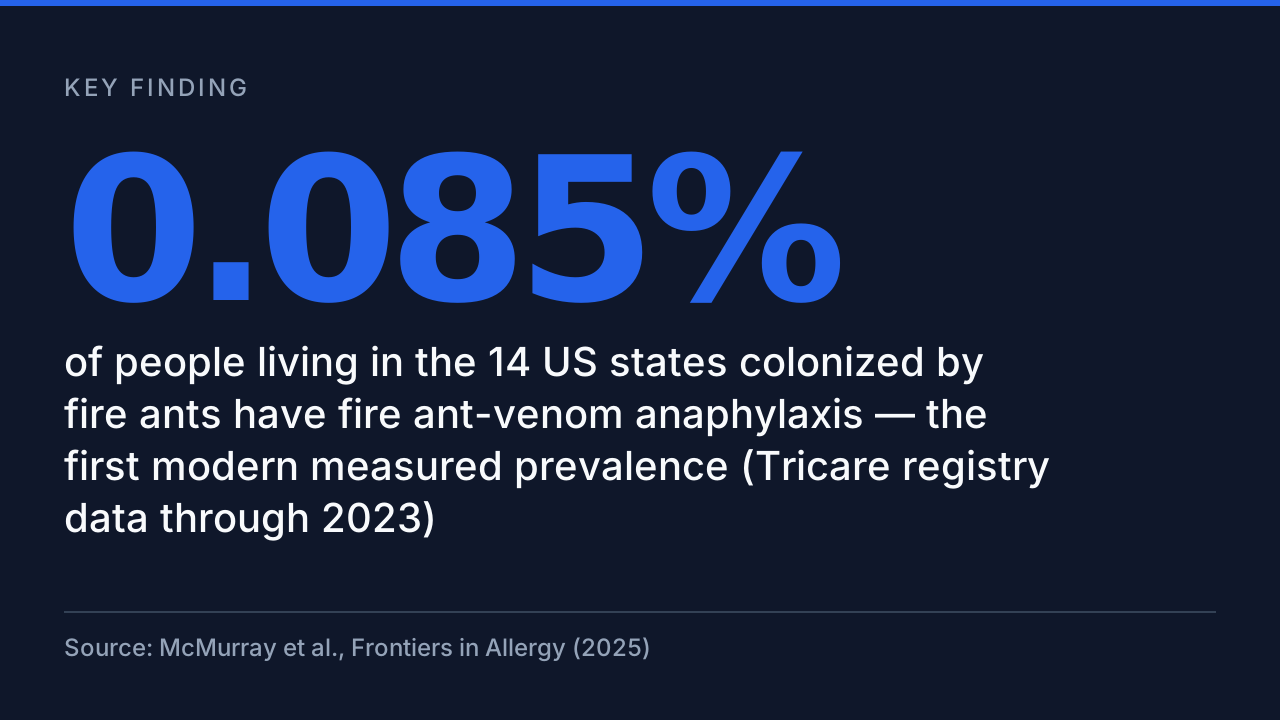
Ask how many people fire ants sting each year and you will get one number, repeated everywhere: 14 million (commonly cited; no primary source traceable) people in the United States. What you will almost never get is the date. That figure is an estimate from extension literature of the year-2000 era — built on an estimate of 40 million (commonly cited; no primary source traceable) people living inside the ant’s range — and in the quarter-century since, nobody has counted again. This page does the thing the repeating pages do not: it dates every figure, names the instrument that produced it, and puts the one modern measurement — a 2025 registry study that found fire ant anaphylaxis prevalence of 0.085% in the colonized states (McMurray et al., Frontiers in Allergy (2025), 2023) — next to the surveys and estimates it has to be read alongside. StingHelp’s wider fire ant coverage starts from its fire ant hub.
One safety rule outranks every statistic below. A fire ant sting that turns into a whole-body reaction — trouble breathing, throat tightness, widespread hives, dizziness or fainting — is anaphylaxis, and anaphylaxis is treated with epinephrine first and a 911 call immediately, not with antihistamines and patience. Know the anaphylaxis warning signs after a sting before you need them; the treatment section at the end of this page shows, in numbers, what happens when that rule is followed late or not at all.
About 40 million (commonly cited; no primary source traceable) people live in the parts of the southeastern United States infested by the red imported fire ant (Thermo Fisher Phadia Allergen Encyclopedia, i70 Fire ant, 2000), across 14 colonized states and Puerto Rico (McMurray et al., Frontiers in Allergy (2025), 2025). The famous annual sting figure is the companion estimate from the same era: 14 million (commonly cited; no primary source traceable) people stung a year (Thermo Fisher Phadia Allergen Encyclopedia, i70 Fire ant, 2000), or 35% (commonly cited; no primary source traceable) of the people living inside the range. Both numbers are roughly twenty-five years old, and neither has ever been replaced by a count.
| METRIC | VALUE | SOURCE |
|---|---|---|
| People living in infested areas of the Southeast (estimate, ~2000) | 40 million (commonly cited; no primary source traceable) | Thermo Fisher Phadia Allergen Encyclopedia, i70 Fire ant |
| Share of them the estimate says are stung each year | 35% (commonly cited; no primary source traceable) | Thermo Fisher Phadia Allergen Encyclopedia, i70 Fire ant |
| Sting attack rate in unexposed adults, endemic area, 1995 | 51% | Tracy et al., Journal of Allergy and Clinical Immunology (1995) |
| US states colonized, plus Puerto Rico | 14 | McMurray et al., Frontiers in Allergy (2025) |
| Newest detection abroad: Sydney, Australia (trap specimens) | 23 September 2026 | Australian Government Department of Agriculture, Fisheries and Forestry |
| Control-order zone radius around the Sydney site | 2 km | NSW Department of Primary Industries and Regional Development |
The measured sting rates explain why the old estimate was plausible when it was made. In San Antonio, Texas, researchers followed previously unexposed medical students through a short training stay in an endemic area: 51% were stung in a matter of weeks (Tracy et al., Journal of Allergy and Clinical Immunology (1995), 1995), and exposure at that intensity is what life inside the range looks like year after year. Almost all of those stings were minor — 96% produced nothing worse than the signature pustule or a small local reaction — which is precisely why a national sting count is so hard to build: the overwhelming majority of stings are never reported to anyone. Whether the insect bites or stings is a common first question; the burden question is harder, because the event usually leaves no record.
The range those estimates describe is not the range that exists now. Fire ants have continued to spread within the US, and in 2026 the species was detected at a freight facility in Sydney, Australia — confirmed on 23 September 2026 (Australian Government Department of Agriculture, Fisheries and Forestry, 2026) — triggering a government control programme around the site. An estimate built on the population inside the range in the year 2000 cannot describe the population inside the range today, in either direction of error. Readers comparing species can also see how the imported fire ant differs from the Argentine ant, a common lookalike invader that does not sting.
The treatment burden rests on two surveys, thirty-seven and twenty-eight years old. In 1989, US physicians reported treating 20,755 patients for fire ant reactions, 2% of them for anaphylaxis (McMurray et al., Frontiers in Allergy (2025), citing the 1989 survey, 1989). In 1998, a survey of South Carolina practitioners estimated 600,000 fire ant attack cases in that one state in a year, of whom 33,000 sought medical treatment and 660 were treated for anaphylaxis (Thermo Fisher Phadia Allergen Encyclopedia, i70 Fire ant, 1998).
| METRIC | VALUE | SOURCE |
|---|---|---|
| Estimated fire ant attack cases, South Carolina, one year (1998 survey) | 600,000 | Thermo Fisher Phadia Allergen Encyclopedia, i70 Fire ant |
| Residents who sought medical treatment (1998 survey) | 33,000 | Thermo Fisher Phadia Allergen Encyclopedia, i70 Fire ant |
| Patients treated for anaphylaxis (1998 survey) | 660 | Thermo Fisher Phadia Allergen Encyclopedia, i70 Fire ant |
| Patients physicians reported treating, national survey (1989) | 20,755 | McMurray et al., Frontiers in Allergy (2025), citing the 1989 survey |
| Share of those treated for anaphylaxis (1989) | 2% | McMurray et al., Frontiers in Allergy (2025), citing the 1989 survey |
| Share of a Taiwan cohort who sought medical care | 7.5% | Thermo Fisher Phadia Allergen Encyclopedia, i70 Fire ant |
Read the two surveys as instruments, not as truth. A practitioner survey measures what clinicians remember treating; it catches the stings severe enough to reach a clinic and misses the rest, and a single humid state at the centre of the range is not the nation. The Taiwan cohort shows the same funnel from the other side: only 7.5% of people stung sought medical care at all (Thermo Fisher Phadia Allergen Encyclopedia, i70 Fire ant, 2022). Everything above the clinic door — the tens of millions of pustules treated with a cold pack and a curse — is invisible to every dataset on this page, which is why no honest annual sting total exists and why this page refuses to manufacture one. What to do for an ordinary sting is covered in StingHelp’s fire ant bite treatment guide.
In 2025, researchers using Tricare health-system data published the first denominator-based prevalence for fire ant anaphylaxis: 0.085% in the fourteen colonized states — 8.5 per 10,000 (McMurray et al., Frontiers in Allergy (2025), 2023) — against 0.048% across all beneficiaries (McMurray et al., Frontiers in Allergy (2025), 2023). For scale, anaphylaxis to all flying Hymenoptera combined measured 0.083% in the same population (McMurray et al., Frontiers in Allergy (2025), 2023): inside the colonized states, the ant that cannot fly outranks every bee and wasp put together.
| METRIC | VALUE | SOURCE |
|---|---|---|
| Fire ant anaphylaxis prevalence, colonized states | 0.085% | McMurray et al., Frontiers in Allergy (2025) |
| Fire ant anaphylaxis prevalence, all beneficiaries | 0.048% | McMurray et al., Frontiers in Allergy (2025) |
| Flying Hymenoptera anaphylaxis prevalence, all beneficiaries | 0.083% | McMurray et al., Frontiers in Allergy (2025) |
| Beneficiaries in the prevalence denominator | 2,835,948 | McMurray et al., Frontiers in Allergy (2025) |
| Estimated beneficiaries with fire ant anaphylaxis | 1,370 | McMurray et al., Frontiers in Allergy (2025) |
The method matters as much as the number. The researchers combined a central immunotherapy prescription database with registry diagnosis codes, then chart-reviewed a sample to correct the codes — most coded records did not survive review, which is why earlier code-counting approaches could not produce a prevalence at all. The honest caveat runs the other way: Tricare beneficiaries are a military population, with active-duty members exposed outdoors at work, so 0.085% may sit above a purely civilian rate for the same states. Even with that caveat, this is the only prevalence figure on this page with a real denominator, and it reframes the older surveys: anaphylaxis uncommon per person, but carried by a large exposed population. Anyone living inside the range with a known venom allergy should have a sting allergy action plan built around numbers like these.
Serious reactions are the exception, but not a rounding error. Across the published literature, systemic allergic reactions are reported in 0.6% to 16% of people stung (Thermo Fisher Phadia Allergen Encyclopedia, i70 Fire ant, 2022) — a wide range, because studies define and select their populations differently. The older shorthand figures for anaphylaxis alone, repeated in review after review, sit inside that same wide band; treat any single point estimate quoted from them with suspicion.
| METRIC | VALUE | SOURCE |
|---|---|---|
| Systemic allergic reactions among people stung (range across studies) | 0.6% to 16% | Thermo Fisher Phadia Allergen Encyclopedia, i70 Fire ant |
| Anaphylactic shock in a 3,819-person Taiwan sting cohort | 2.78% | Thermo Fisher Phadia Allergen Encyclopedia, i70 Fire ant |
| Wheal-and-flare reactions in the same cohort | 21.8% | Thermo Fisher Phadia Allergen Encyclopedia, i70 Fire ant |
| Newcomers who developed fire ant-specific IgE within weeks | 16% | Tracy et al., Journal of Allergy and Clinical Immunology (1995) |
| Highest sensitization rates reported in colonized regions | >90% | McMurray et al., Frontiers in Allergy (2025) |
| Time for the sterile white pustule to appear after a sting | one day | Thermo Fisher Phadia Allergen Encyclopedia, i70 Fire ant |
The denominators explain the spread, and confusing them is how bad statistics happen. The 0.6% to 16% range is per person stung, drawn from clinical series; the 2025 prevalence is per person living in a place, drawn from a registry. Both can be true at once. The Taiwan cohort sits between them: 21.8% developed wheal-and-flare reactions and 2.78% went into anaphylactic shock (Thermo Fisher Phadia Allergen Encyclopedia, i70 Fire ant, 2022) — a reminder that a single well-counted sting population can land anywhere in the classic range. Sensitization is the quieter number: newcomers developed fire ant-specific IgE in 16% of cases within weeks of their first stings, and in colonized regions sensitization rates can exceed >90% (McMurray et al., Frontiers in Allergy (2025), 2025). A positive test is not the same as clinical allergy — most sensitized people never have a systemic reaction — but it is the pool from which reactions come.
The skin sign itself needs no test: the sterile white pustule appears in about one day, and the rule is to leave it intact — StingHelp’s guide to fire ant sting pustules and what not to do explains why popping it invites the infection the pustule itself is not. Distinguishing a large local reaction from the start of anaphylaxis is covered in large local reaction vs anaphylaxis, and the warning signs are sharper for fire ant stings in children.
The death record is a single survey, and it is from 1989. A questionnaire sent to 29,300 physicians by the American Academy of Allergy and Immunology’s Fire Ant Subcommittee returned reports of 83 fatal and 2 near-fatal fire ant sting reactions (Rhoades, Stafford & James, Journal of Allergy and Clinical Immunology (1989), 1989), concentrated in Florida (22) and Texas (19). After duplicate reports were removed, 32 deaths remained (McMurray et al., Frontiers in Allergy (2025), 1989). Most of the fatal cases followed fewer than five stings (Thermo Fisher Phadia Allergen Encyclopedia, i70 Fire ant, 1989).
| METRIC | VALUE | SOURCE |
|---|---|---|
| Fatal reactions reported to the 1989 physician survey | 83 | Rhoades, Stafford & James, Journal of Allergy and Clinical Immunology (1989) |
| Near-fatal reactions reported to the same survey | 2 | Rhoades, Stafford & James, Journal of Allergy and Clinical Immunology (1989) |
| Deaths remaining after duplicate reports were removed | 32 | McMurray et al., Frontiers in Allergy (2025) |
| Fatal-reaction reports from Florida | 22 | Rhoades, Stafford & James, Journal of Allergy and Clinical Immunology (1989) |
| Fatal-reaction reports from Texas | 19 | Rhoades, Stafford & James, Journal of Allergy and Clinical Immunology (1989) |
| Stings involved in most fatal cases | fewer than five | Thermo Fisher Phadia Allergen Encyclopedia, i70 Fire ant |
Two cautions belong with this table. First, the survey collected reports from physicians’ memories and records across their careers, not deaths in a single year — 83 is a career-spanning case series, not an annual death rate, and pages that print ’83 deaths’ as a yearly figure are misreading it. Second, the deduplication is the story inside the story: the same death reported by two physicians was counted twice in the raw returns, which is why the confirmed count is 32. What has not changed since is the mechanism: these were anaphylaxis deaths, most after very few stings, which makes recognition and epinephrine — not sting avoidance alone — the controllable variable. The 2025 study adds a bleak footnote: no fire ant mortality study has been published since this survey, so the modern death toll is not smaller or larger than 1989’s record. It is simply uncounted.
Treatment data tells two opposite stories. Demand is unambiguous: fire ant whole-body extract accounted for 45.9% of individual immunotherapy prescriptions in the Tricare system (McMurray et al., Frontiers in Allergy (2025), 2023), and cumulative fire ant prescriptions have passed all flying Hymenoptera prescriptions combined in six colonized states (McMurray et al., Frontiers in Allergy (2025), 2023). Response, at the moment it matters, is not: in the 2025 mastocytosis cohort, anaphylaxis episodes were treated with epinephrine only 37.9% of the time (McMurray et al., Frontiers in Allergy (2025), 2025).
| METRIC | VALUE | SOURCE |
|---|---|---|
| Fire ant share of individual immunotherapy prescriptions (878 orders) | 45.9% | McMurray et al., Frontiers in Allergy (2025) |
| States where fire ant orders passed all flying Hymenoptera combined | six | McMurray et al., Frontiers in Allergy (2025) |
| Mastocytosis patients whose anaphylaxis was fire ant-triggered | 32.6% | McMurray et al., Frontiers in Allergy (2025) |
| Mastocytosis patients triggered by all flying Hymenoptera combined | 25.6% | McMurray et al., Frontiers in Allergy (2025) |
| Anaphylaxis episodes in that cohort treated with epinephrine | 37.9% | McMurray et al., Frontiers in Allergy (2025) |
| Fire ant episodes not initially recognised or not treated with epinephrine | Nearly half | McMurray et al., Frontiers in Allergy (2025) |
The mastocytosis numbers carry the warning. Systemic mastocytosis is a mast-cell disorder that makes anaphylaxis more likely and more severe, and in that cohort fire ants triggered anaphylaxis in 32.6% of patients — more than all flying Hymenoptera combined at 25.6% (McMurray et al., Frontiers in Allergy (2025), 2025). Yet across the cohort’s episodes, epinephrine was given only 37.9% of the time, and for fire ant episodes specifically, nearly half were not initially recognised as anaphylaxis or treated with epinephrine at all. These are patients inside a specialist health system, carrying a known high-risk diagnosis. For everyone else, the practical read is direct: know in advance whether a second dose might be needed — StingHelp covers when to give a second EpiPen dose — and what to do after using an EpiPen, because the data says the failure mode is not a missing drug. It is a missed diagnosis in the first minutes.


How this page was built, including what could not be run at full strength. Demand for this topic was assessed in a degraded pass: Reddit’s public endpoints are blocked from this research host and no ScrapeCreators key was available, so Stage 1 demand mining ran through manual web-search routes and this cluster’s thread demand is unmeasured rather than counted. Stage 2’s SERP cross-check ran through host web search because no DataForSEO key was available. Stage 3, the backlink format filter, DID NOT RUN — it needs a paid backlinks API, so no format percentages are claimed anywhere in this run. Stage 4’s existence gate ran manually over a fresh 689-URL corpus built from stinghelp.com’s own sitemaps, returning CLEAR for this topic, because the vendor’s sitemap script fails on this host. Stage 6a’s recency sweep script crashed on its Reddit leg for the same host block and was replaced with a manual dated web sweep. Two sources block automated checkers — PubMed and the Australian agriculture department — so the facts drawn from them were confirmed by opening the pages and reading the values directly, which the fact sheet records per fact. All visuals are charts drawn locally from the fact sheet; no image-generation API was used. Two evidence limits belong on the record: the 2025 prevalence study covers Tricare (military) beneficiaries, whose outdoor occupational exposure may push prevalence above a purely civilian figure; and the 1998 South Carolina survey and the Taiwan cohort are cited through a peer-reviewed allergen encyclopedia’s summary because the primary papers are paywalled or undated on the carrier page. The 14-million and 40-million figures are labelled unverified in the fact sheet and contested in the text: they are estimates from year-2000-era extension literature with no traceable primary measurement behind them.
Nobody has counted recently. The figure in circulation — 14 million people a year in the US — is an estimate from extension literature of the year-2000 era, built on a population estimate of 40 million people in infested areas, and it has never been re-measured. Measured sting rates from endemic areas are high: in a 1995 study, 51% of previously unexposed adults were stung during a short stay in San Antonio, Texas. (Thermo Fisher Phadia Allergen Encyclopedia, i70 Fire ant, 2000)
The first modern measurement, published in 2025 from Tricare health-system data, put fire ant-venom anaphylaxis prevalence at 0.085% in the 14 colonized states — 8.5 per 10,000 people — and 0.048% across the whole beneficiary population. Older clinical literature expresses the risk per sting victim instead, reporting systemic reactions in 0.6% to 16% of people stung, which is a different denominator and not a contradiction. (McMurray et al., Frontiers in Allergy (2025), 2023)
Yes, through anaphylaxis, though it is rare. A 1989 survey of 29,300 US physicians collected reports of 83 fatal fire ant sting reactions; after duplicate reports were removed, 32 deaths remained, and most fatal cases involved fewer than five stings. No mortality study has been published since. If a sting is followed by trouble breathing, throat tightness, widespread hives or faintness, use epinephrine if you have it and call 911 — anaphylaxis is the emergency, not the number of stings. (Rhoades, Stafford & James, Journal of Allergy and Clinical Immunology (1989), 1989)
No. The white pustule that appears about one day after a fire ant sting is sterile — it is not an infection, and it is the signature sign of a fire ant sting. Scratching or popping it breaks the skin barrier and is how secondary bacterial infections start. Keep it clean, leave it intact, and watch for spreading redness, increasing pain or fever over the following days, which are the signs that do need medical care. (Thermo Fisher Phadia Allergen Encyclopedia, i70 Fire ant, 2022)
Fourteen states, plus Puerto Rico, are colonized by red and black imported fire ants, according to the 2025 prevalence study — concentrated in the Southeast and Gulf Coast, with Florida and Texas historically reporting the most fatal reactions. In six of those states, fire ant immunotherapy orders have overtaken all bee, wasp, hornet and yellow jacket immunotherapy combined. (McMurray et al., Frontiers in Allergy (2025), 2025)
Yes. In September 2026, red imported fire ants were detected at a freight facility in Strathfield, Sydney, Australia — confirmed on 25 September 2026 — and New South Wales placed biosecurity control orders over a 2 km zone, in effect from 26 October 2026. The same species established itself in Sicily in 2023. The range behind every US statistic on this page is still expanding. (Australian Government Department of Agriculture, Fisheries and Forestry, 2026)
Because even specialists' patients miss it. In the 2025 Tricare mastocytosis cohort — a high-risk group under active care — only 37.9% of anaphylaxis episodes were treated with epinephrine, and nearly half of fire ant anaphylaxis episodes were not initially recognised as anaphylaxis at all. Anaphylaxis after any sting is an epinephrine-first emergency: use the auto-injector at the first sign of a whole-body reaction, then call 911, rather than waiting to see whether it passes. (McMurray et al., Frontiers in Allergy (2025), 2025)
Last updated:
This article is for informational purposes only and isn’t medical advice. If you’re worried about a bite or sting, talk to a healthcare professional.
Dr. Jones oversees StingHelp’s clinical verification process. Every guide is systematically evaluated against active Centers for Disease Control and Prevention (CDC), Environmental Protection Agency (EPA), and American Academy of Allergy, Asthma & Immunology (AAAAI) medical consensus standards to ensure symptom distinctions and care recommendations are clinically sound.
Explore physician-reviewed first-aid procedures, identification clues, and symptom comparisons for other common outdoor bites and stings.
Every fall, millions of kids take the field for soccer, football, and baseball across the southern US — and many of those fields sit…
Somewhere in the American South, a neighbor is standing over a fire ant mound with a box of grits. The folk wisdom runs like…

Pull into a state park in Texas, Louisiana, Florida, or Georgia, pick a shady campsite, and step out barefoot to level your trailer —…