
Why Do Wasps Sting Unprovoked? The Real Triggers Explained
Introduction: The Short Answer Wasps rarely sting for no reason at all, even when the sting feels completely unprovoked to the person who receives…
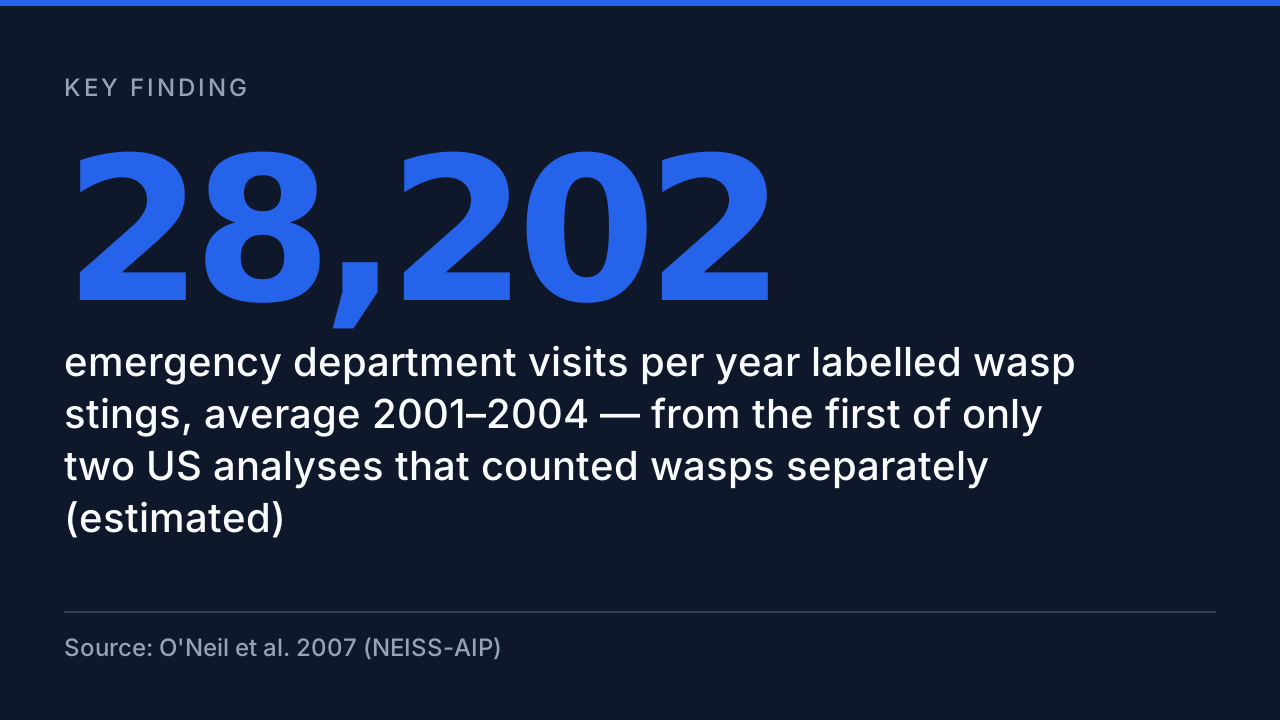
The only sourced US counts of wasp and yellow jacket stings — 28,202 and 11,797 emergency department visits a year in 2001–2004 — with every newer combined bee/wasp/hornet figure labelled and dated.
Source: O'Neil et al. 2007 (NEISS-AIP) (2004)
Bees get a statistic. Wasps get a shrug. Ask how many wasp stings happen in the United States each year and the internet answers with combined bee-and-wasp totals, or with round numbers no study ever produced. The sourced answer exists, but it comes with a date on it: US emergency departments treated an estimated 28,202 people a year for wasp stings in 2001–2004, and 11,797 a year for yellow jacket stings (O'Neil et al. 2007 (NEISS-AIP), 2004). Those figures come from the NEISS-AIP hospital surveillance system, and they are the first of only two analyses that have ever counted wasps separately. StingHelp’s guide to wasps, hornets and yellowjackets covers identifying the insects themselves; this page covers their measured burden.
One rule comes before every number on this page. The mechanism that kills in these statistics is anaphylaxis, a whole-body allergic reaction that can close the airway within minutes. If a wasp or yellow jacket sting brings trouble breathing, throat tightness, widespread hives, dizziness or collapse, use an epinephrine auto-injector if one is available and call 911 or go to the nearest emergency department immediately. Do not wait to see whether it passes, and do not rely on an antihistamine. Know the anaphylaxis warning signs after a sting and what to do after using an EpiPen before you need them.
Read the tables below the way the sources wrote them. Every figure carries its years and a label: estimated for weighted hospital-sample numbers, measured for complete death-certificate counts, reported for cases phoned in to poison centers. Where a system counts hornets, wasps and bees together, the row says COMBINED in capitals, because passing a combined total off as a wasp count is exactly the error this page exists to correct. The two splits disagree slightly with each other; both are printed, dated, and neither is dressed up as the current rate.
In the first NEISS-AIP analysis, covering 2001–2004, emergency departments treated an estimated 44,432 vespid sting patients a year: 28,202 labelled wasp, 11,797 labelled yellow jacket and 3,644 labelled hornet (O'Neil et al. 2007 (NEISS-AIP), 2004). Vespids were a small slice of the 230,328 Hymenoptera visits counted in the same years.
| METRIC | VALUE | SOURCE |
|---|---|---|
| Vespid total — wasp, yellow jacket, hornet, other vespid [estimated] | 44,432 | O'Neil et al. 2007 (NEISS-AIP) |
| Wasp stings [estimated] | 28,202 | O'Neil et al. 2007 (NEISS-AIP) |
| Yellow jacket stings [estimated] | 11,797 | O'Neil et al. 2007 (NEISS-AIP) |
| Hornet stings [estimated] | 3,644 | O'Neil et al. 2007 (NEISS-AIP) |
| Bee stings, shown for scale [estimated] | 162,299 | O'Neil et al. 2007 (NEISS-AIP) |
| Ant bites and stings [estimated] | 21,711 | O'Neil et al. 2007 (NEISS-AIP) |
| Hymenoptera total — bee, vespid, ant, other [estimated] | 230,328 | O'Neil et al. 2007 (NEISS-AIP) |
| All noncanine bites and stings (the denominator) [estimated] | 916,168 | O'Neil et al. 2007 (NEISS-AIP) |
NEISS-AIP is a national probability sample of hospital emergency departments. Coders read the short narrative written for each visit and classified the source of the bite or sting, and the weighted results are national estimates, not raw counts. That method is what makes a species split possible at all — and also what limits it. The insect named in the table is the insect named in the chart, which is usually the word the patient used. Nobody collected the insect, and nobody keyed the identification. The honest way to read the wasp row is as the count of emergency visits where the record said ‘wasp’ — a floor under the true wasp burden, not a census of it.
One piece of taxonomy matters before anyone quotes these numbers. A yellow jacket is a wasp. The ‘wasp’ row in this table is the residual category: wasp stings that the chart did not identify more precisely, while the yellow jacket and hornet rows hold the visits where the record named the insect. That is why the rows must never be added into a headline about ‘wasp stings’ as if the wasp row stood alone, and why claims that yellow jackets cause most wasp stings cannot be settled from this table either way. If you are dealing with the insects rather than the data, start with yellowjacket vs honeybee identification and the guide to what to do after a yellow jacket sting.
The follow-up analysis, covering 2001–2010, found 40,412 vespid visits a year: 26,939 labelled wasp, 9,134 yellow jacket and 3,774 hornet (Langley et al. 2014 (NEISS-AIP), 2010). Set beside the earlier window, every vespid row moved a little and none moved much — the two analyses are best read as two measurements of the same burden, not as a rise or a fall.
| METRIC | VALUE | SOURCE |
|---|---|---|
| Vespid total — wasp, yellow jacket, hornet, other vespid [estimated] | 40,412 | Langley et al. 2014 (NEISS-AIP) |
| Wasp stings [estimated] | 26,939 | Langley et al. 2014 (NEISS-AIP) |
| Yellow jacket stings [estimated] | 9,134 | Langley et al. 2014 (NEISS-AIP) |
| Hornet stings [estimated] | 3,774 | Langley et al. 2014 (NEISS-AIP) |
| Bee stings, shown for scale [estimated] | 162,080 | Langley et al. 2014 (NEISS-AIP) |
| Hymenoptera total — bee, vespid, ant, other [estimated] | 221,718 | Langley et al. 2014 (NEISS-AIP) |
| Vespid stings in 2001, single year [estimated] | 43,795 | Langley et al. 2014 (NEISS-AIP) |
| Vespid stings in 2010, single year [estimated] | 34,158 | Langley et al. 2014 (NEISS-AIP) |
It is tempting to line the two windows up and announce that wasp stings fell. Resist it. The windows overlap by four years, the estimates carry wide confidence intervals, and the same paper’s year-by-year table shows the vespid estimate moving between roughly the mid-thirty-thousands and just under fifty thousand across the decade without any clean direction. Two overlapping sample estimates that differ by a few percent are two readings of one quantity. What the second analysis actually adds is confirmation: measured over a full decade, wasps remained the largest single vespid label in emergency records, ahead of yellow jackets and hornets, at something like twenty-seven thousand visits a year.
After this paper, the split ends. No analysis of NEISS-AIP data from later years has published a wasp, yellow jacket or hornet row, which is why everything after 2010 in this article wears a combined label. The practical burden did not end with the data, of course: a yellow jacket sting still runs the course described in how long a yellow jacket sting lasts, and the behaviour behind many encounters is explained in why wasps sting more than once. The statistics simply stopped separating the insects that cause it.
Every current US system folds wasps into a combined hornet, wasp and bee category. Hospitals recorded 812,357 combined encounters across 2010–2014 (Forrester et al. 2018 (NEDS), 2014); poison centers logged 2,648 combined cases in 2024 (Medscape eMedicine, Hymenoptera Stings (reproducing NPDS 2024), 2024); and death certificates counted an average of 72 combined deaths a year in 2011–2021 (CDC MMWR QuickStats 2023 (NVSS), 2021). None of these can be divided by insect.
| METRIC | VALUE | SOURCE |
|---|---|---|
| ED encounters, hornet/wasp/bee, 2010–2014 total [estimated, COMBINED] | 812,357 | Forrester et al. 2018 (NEDS) |
| Admitted as inpatients, hornet/wasp/bee, 2010–2014 total [estimated, COMBINED] | 9,041 | Forrester et al. 2018 (NEDS) |
| Cases reported to poison centers, 2024 [reported, COMBINED] | 2,648 | Medscape eMedicine, Hymenoptera Stings (reproducing NPDS 2024) |
| Poison-center cases with moderate outcomes, 2024 [reported, COMBINED] | 185 | Medscape eMedicine, Hymenoptera Stings (reproducing NPDS 2024) |
| Poison-center cases with major outcomes, 2024 [reported, COMBINED] | 13 | Medscape eMedicine, Hymenoptera Stings (reproducing NPDS 2024) |
| Deaths among poison-center cases, 2024 [reported, COMBINED] | 4 | Medscape eMedicine, Hymenoptera Stings (reproducing NPDS 2024) |
| Deaths, hornet/wasp/bee, 2011–2021 total [measured, COMBINED] | 788 | CDC MMWR QuickStats 2023 (NVSS) |
| Deaths, hornet/wasp/bee, 2018–2023 total [measured, COMBINED] | 497 | Langley & Kearney 2025 (CDC WONDER) |
| Deaths, hornet/wasp/bee, 2000–2017 total [measured, COMBINED] | 1,109 | Medscape eMedicine, Hymenoptera Stings (citing NVSS / MMWR 2019) |
| Deaths per year, hornet/wasp/bee, 2000–2017 average [measured, COMBINED] | 62 | Medscape eMedicine, Hymenoptera Stings (citing NVSS / MMWR 2019) |
Lay the systems side by side and their shapes explain their totals. The NEDS hospital sample is the widest funnel: hundreds of thousands of combined encounters over five years, of which about one percent ended in admission. Poison centers are the narrowest: a few thousand combined cases a year, skewed serious because nobody calls a poison line about a sting that stopped hurting. Death certificates are the only complete count, and they are also the bluntest instrument — one combined category for hornet, wasp and bee stings, with no wasp-only lane anywhere in the coding system. A wasp-only death toll is not a number that exists, and any website that offers one has divided a combined figure by a guess.
The death averages also refuse to sit still: 62 a year across 2000–2017, 72 a year across 2011–2021, and 497 deaths packed into just 2018–2023. The windows overlap, so these are not three different facts but three readings of a combined series that has, if anything, risen in recent years. What none of them can say is which insect drove the rise. For the encounters behind the combined rows, see multiple bee, wasp and hornet stings, allergy and venom.
The split was a publishing choice, and the choice changed. The NEISS-AIP analysis for 2011–2015 reported 1.17 million noncanine bite and sting visits a year and an insect share of 71.0%, but no Hymenoptera species rows at all (Hareza et al. 2020 (NEISS-AIP), 2015). From that window on, the wasp disappears into categories too broad to separate.
| METRIC | VALUE | SOURCE |
|---|---|---|
| All noncanine bite and sting ED visits per year, 2011–2015 [estimated, BROADER] | 1.17 million | Hareza et al. 2020 (NEISS-AIP) |
| Insect share of those visits, 2011–2015 [estimated, BROADER] | 71.0% | Hareza et al. 2020 (NEISS-AIP) |
| ED visits labelled only ‘insect (unspecified)’, 2001–2004 [estimated] | 359,378 | O'Neil et al. 2007 (NEISS-AIP) |
| Share of bite and sting ED visits in June–September, 2001–2004 [estimated, BROADER] | 60.3% | O'Neil et al. 2007 (NEISS-AIP) |
Part of the story is measurement discipline. Even in the split years, the biggest category in the data was ‘insect (unspecified)’, and the analysts of the later window may simply have declined to publish rows built on chart labels they trusted less. Part of it is category design: the death-certificate system never had a wasp lane to begin with. And part of it is attention. Bees have growers, keepers and a conservation movement asking after their numbers, so bee figures keep getting extracted and republished; wasps have no constituency, and nobody’s funding depends on keeping their count current. The number did not become false in 2010. It became unpublished.
Into that vacuum, unsourced numbers move. Pest-control marketing pages currently state precise-looking annual wasp sting totals that trace to no surveillance system and no study; they are repeated from site to site until repetition looks like sourcing. The correct response is not a better guess. It is the position this page takes: print the measured split with its years on it, print the combined totals with their labels on them, and say plainly that for any year after 2010, a wasp-only US figure does not exist.
Most vespid sting patients go home: 1.2% of them were hospitalized in 2001–2004 (O'Neil et al. 2007 (NEISS-AIP), 2004). The serious tail is allergic rather than toxic — 25,360 patients a year arrived at emergency departments with anaphylactic signs or symptoms after a Hymenoptera sting, and 3.4% of those patients were hospitalized (O'Neil et al. 2007 (NEISS-AIP), 2004).
| METRIC | VALUE | SOURCE |
|---|---|---|
| Anaphylactic-signs patients per year after a Hymenoptera sting [estimated, COMBINED] | 25,360 | O'Neil et al. 2007 (NEISS-AIP) |
| Anaphylaxis-signs patients treated and released [estimated, COMBINED] | 95.1% | O'Neil et al. 2007 (NEISS-AIP) |
| Anaphylaxis-signs patients hospitalized [estimated, COMBINED] | 3.4% | O'Neil et al. 2007 (NEISS-AIP) |
| Share of anaphylaxis-signs cases attributed to bee stings [estimated] | 49.6% | O'Neil et al. 2007 (NEISS-AIP) |
| Vespid sting patients hospitalized [estimated] | 1.2% | O'Neil et al. 2007 (NEISS-AIP) |
| Vespid sting injuries to the arm or hand [estimated] | 39.7% | O'Neil et al. 2007 (NEISS-AIP) |
| Vespid sting injuries to the head or neck [estimated] | 23.6% | O'Neil et al. 2007 (NEISS-AIP) |
The pattern in the severity data is consistent: the average vespid sting that reaches an emergency department is a painful local event, treated and released, most often on the arm or hand, and very often in summer — 60.3% of all bite and sting visits in the earlier window fell between June and September. What turns a sting into an emergency is not the species but the immune system of the person stung. That is why the emergency guidance never asks which insect it was: breathing difficulty, throat or tongue swelling, widespread hives, faintness or vomiting after any sting means epinephrine and emergency care, in that order, immediately.
For everything short of that emergency, work through wasp sting first aid step by step, and know the difference between a large local reaction and anaphylaxis before you have to make the call. If a first epinephrine dose is wearing off and symptoms return, the timing rules for a second EpiPen dose matter. Swarm encounters are a separate case again — follow the multiple wasp stings first aid guidance, because dose of venom, not allergy, drives that risk.


This page was built by the DataGap Method in a fully degraded run, and the degraded stages are part of the record. Demand for this topic was unmeasured in its discovery run — its counted thread demand was zero — and the demand stage ran manually through host web search because the Reddit route is blocked from this host and no ScrapeCreators key was available. The supply-side format check (which formats earn citations on this topic) did not run. The recency sweep script returned zero items under the same Reddit block, with its video and web legs unavailable without a key, so the sweep was completed by hand through web search; it found no newer split and nothing superseding the figures used here. The existence gate was run manually over the site’s sitemap corpus in the discovery run and returned CLEAR for this topic. Two source-handling notes: the 2007 analysis renders its key table as images in the PMC record, so its values were read in the journal’s full-text copy, a host that blocks automated checkers — every value from it was confirmed in a browser during this run; and the poison-center figures are cited to the clinical overview that reproduces the 2024 NPDS table verbatim, because the report’s own publisher page blocks automated access. Images were drawn locally from the fact sheet; no image API and no paid tool was used at any stage.
Nobody knows the current figure, because no US system has published a wasp-only count since the NEISS-AIP analyses. The last measurements are emergency department estimates: 28,202 visits a year labelled wasp stings in 2001–2004, and 26,939 a year across 2001–2010. Most stings never reach an emergency department, so the true number of stings is far higher than either figure. (O'Neil et al. 2007 (NEISS-AIP), 2004)
The only sourced counts are the same two NEISS-AIP windows: 11,797 emergency department visits a year labelled yellow jacket stings in 2001–2004, and 9,134 a year across 2001–2010. Yellow jackets are a kind of wasp; the 'wasp' row in these tables is the residual label for wasps that were not identified more precisely, so the two rows should never be added to or ranked against each other as if they were rival species counts. (O'Neil et al. 2007 (NEISS-AIP), 2004)
By the labels in the chart, bees — by a wide margin: 162,299 visits a year labelled bee stings in 2001–2004 against 44,432 for all vespids combined. Read that with care, though: the labels are what patients and charts said, and 'bee' is the word most people use for any stinging insect, so the bee row absorbs stings that were probably wasps. (O'Neil et al. 2007 (NEISS-AIP), 2004)
Because every current system publishes a combined category. The NEISS-AIP update for 2011–2015 reported 1.17 million noncanine bite and sting visits a year with no species split; death certificates group hornet, wasp and bee stings under one category; and poison centers publish one combined 'bee, wasp, or hornet' row. The split did not become wrong — it stopped being published. (Hareza et al. 2020 (NEISS-AIP), 2015)
It cannot be separated out. US death certificates record one combined category — hornet, wasp and bee stings — which averaged 72 deaths a year in 2011–2021 and totaled 497 deaths in 2018–2023. Any source giving a wasp-only death toll is guessing; the honest figure is the combined one, with its label on it. (CDC MMWR QuickStats 2023 (NVSS), 2021)
Treat it as anaphylaxis, a medical emergency. If the person has an epinephrine auto-injector, use it immediately — epinephrine is the first-line treatment — then call 911 and get emergency care, even if symptoms ease, because a second wave can follow. Do not drive yourself. Antihistamines are not a substitute for epinephrine. (Mayo Clinic, 2026)
Most are treated and sent home: 1.2% of vespid sting patients in 2001–2004 were hospitalized. The serious tail is allergic. In the same study, 25,360 patients a year arrived with anaphylactic signs or symptoms after a Hymenoptera sting, and 3.4% of them were hospitalized — which is why a sting that affects breathing, the throat or circulation is an emergency, not a wait-and-see. (O'Neil et al. 2007 (NEISS-AIP), 2004)
Last updated:
This article is for informational purposes only and isn’t medical advice. If you’re worried about a bite or sting, talk to a healthcare professional.
Dr. Jones oversees StingHelp’s clinical verification process. Every guide is systematically evaluated against active Centers for Disease Control and Prevention (CDC), Environmental Protection Agency (EPA), and American Academy of Allergy, Asthma & Immunology (AAAAI) medical consensus standards to ensure symptom distinctions and care recommendations are clinically sound.
Explore physician-reviewed first-aid procedures, identification clues, and symptom comparisons for other common outdoor bites and stings.
Introduction: The Short Answer Wasps rarely sting for no reason at all, even when the sting feels completely unprovoked to the person who receives…
You have just been stung, and your first instinct is to look for the stinger. Do wasp stings leave a stinger? No, they do…
# Are Yellow Jackets Active at Night? The short answer is no, yellow jackets are not really active at night. These wasps are daytime…